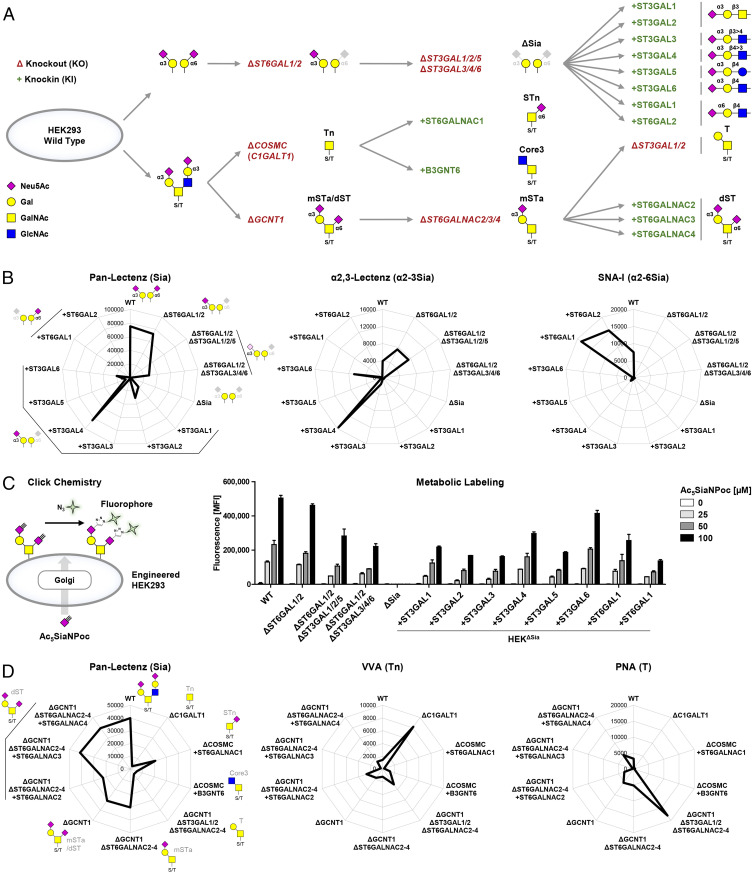
Fig. 1.
Generation of the sialoglycan sublibraries. (A) Scheme showing the sublibrary approach for display of α2-3 and α2-6 sialic acid capping of galactose and display of sialylated O-glycans by combinatorial KO (Δ) of endogenous genes (capitalized and italicized) and individual KI (+) of sialyltransferase complementary DNA (capitalized and nonitalicized). Starting from HEKWT cells, ST6GAL1/2 were knocked out to delete α2-6-sialylation of galactose. Next, ST3GAL1/2/5 and ST3GAL3/4/6 were knocked out in sets or combined. ST3GAL1-6 KO was performed, thus deleting α2-3-sialylation capacity. In these empty cells, HEKΔSia, the deleted sialyltransferase genes were knocked in individually. HEKWT cells predictably express a mixture of mSTa (Neu5Acα2-3Galβ1-3GalNAcα1-O-Ser/Thr), dST (Neu5Acα2-3Galβ1-3[Neu5Acα2-6]GalNAcα1-O-Ser/Thr), and sialylated core2 structures. COSMC (or C1GALT1) was knocked out for display of the Tn (GalNAcα-O-Thr/Ser) antigen followed by KI of either ST6GALNAC1 or B3GNT6 yielding STn (Neu5Acα2-6GalNAcα-O-Thr/Ser) or core3 structures (GlcNAcβ1-3GalNAcα1-O-Ser/Thr), respectively. Alternatively, GCNT1 was knocked out resulting in display of a mixture of mSTa/dST and combined KO of ST6GALNAC2/3/4-produced mSTa. Further KO of ST3GAL1/2 produced the T antigen (Galβ1-3GalNAcα1-O-Ser/Thr), and individual KI of ST6GALNAC2/3/4 yielded cells with dST expression. Predicted sialoglycan structures are depicted according to the Symbol Nomenclature for Glycans (92). (B) Radar charts show binding of Pan-Lectenz (Sia), α2-3-Lectenz (α2-3Sia), or SNA-I (α2-6Sia) to the sialic acid capping sublibrary. Lectin binding was quantified by flow cytometry, and data are shown as mean fluorescence intensity (MFI) values from three independent experiments. (C) Scheme illustrating metabolic labeling of cells with Ac5SiaNPoc that is incorporated into cell surface glycans and conjugated to fluorescent azide-biotin using click chemistry. Bar diagram shows metabolic labeling of the capping sublibrary with 0 to 100 µM Ac5SiaNPoc as average MFI ± SEM of three independent experiments. (D) Radar charts show binding of Pan-Lectenz (Sia), VVA (Tn), and PNA (T) to the O-glycan sublibrary as representative MFI values of three independent experiments.

