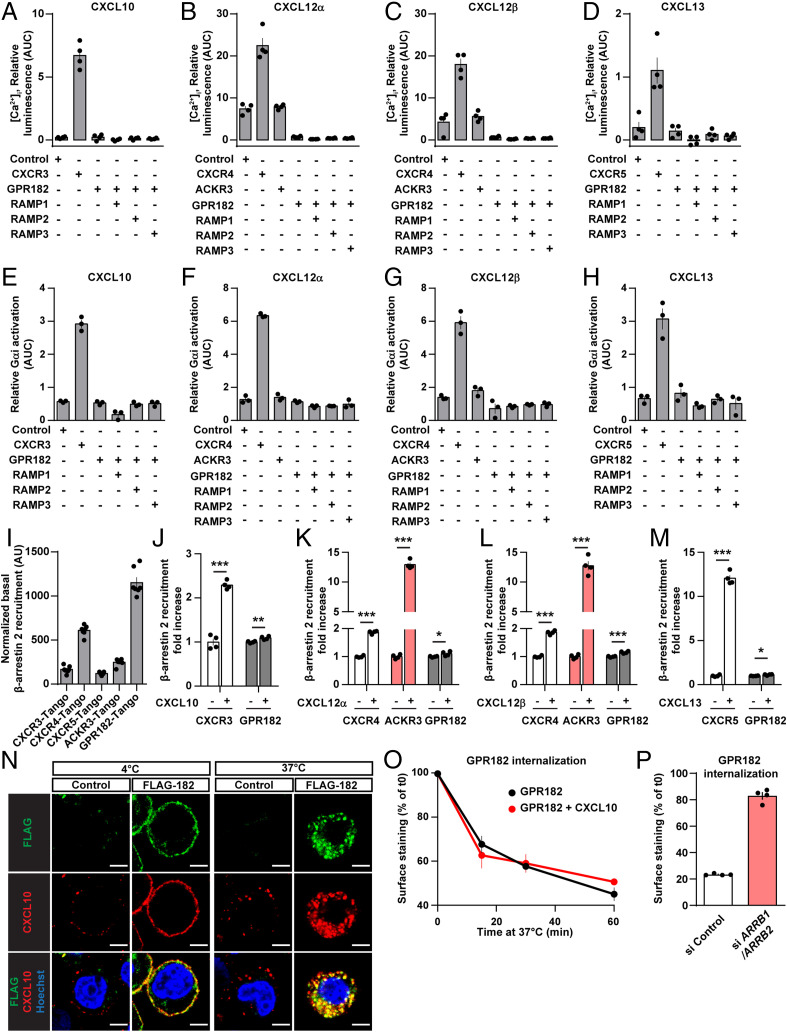
Fig. 3.
GPR182 does not signal in response to ligand binding. (A–D) Effect of the indicated chemokines on [Ca2+]i in HEK293 cells expressing the indicated receptors together with Ca2+-sensitive bioluminescent fusion protein (G5A) (n = 3 replicates and 3 independent experiments). (E–H) Effect of the indicated chemokines on Gαi activity using the Gαi NanoBiT assay system, as described in Methods in HEK cells transfected with the indicated human receptors (n = 3 replicates and 1 experiment). (I) Ligand-independent recruitment of β-arrestin by GPR182 and several other conventional and ACKRs (n = 7 replicates). (J–M) Effect of the indicated chemokines on β-arrestin recruitment to GPR182 using the TANGO assay system as described in Methods (n = 4 replicates and 3 independent experiments). (N) Single-cell suspension HEK293T cells expressing FLAG-tagged human GPR182 and control cells (control) were incubated at 4 °C for 1 h in the presence of 100 nM of hCXCL10-AF647 and FITC-coupled anti-FLAG antibody, followed by 3 washes and 30 min of incubation at 37 °C. Thereafter cells were fixed and stained with Hoechst dye and fluorescence analyzed by confocal microscopy. (O) Cells expressing FLAG-tagged GPR182 were incubated at 4 °C with an anti-FLAG antibody, and subsequently incubated at 37 °C in the presence or absence of hCXCL10 (100 nM). After incubation for increasing time periods, cells were stained with a secondary antibody to reveal FLAG-GPR182 at the cell surface, which was then quantified by flow cytometry. (n = 3 replicates). Shown are mean values ± SEM of one experiment; *P ≤ 0.05; **P ≤ 0.01; and ***P ≤ 0.001; n.s., nonsignificant (unpaired two-tailed Student’s t test). (P) Cells expressing FLAG-tagged GPR182 were, in addition, transfected with control siRNA (si Control) or siRNA against β-arrestin-1 and β-arrestin-2 (si ARRB1/ARRB2). Cells were incubated at 4 °C with an anti-FLAG antibody and subsequently incubated at 37 °C for 60 min. After incubation, cells were incubated with a secondary antibody to stain FLAG-GPR182 at the cell surface. Surface staining was then quantified by flow cytometry. Data are represented as percentage of surface staining relative to basal surface staining of cells kept at 4 °C (which inhibits internalization). Shown is one representative experiment of two independently performed experiments. Shown are mean values ± SEM of one experiment.

