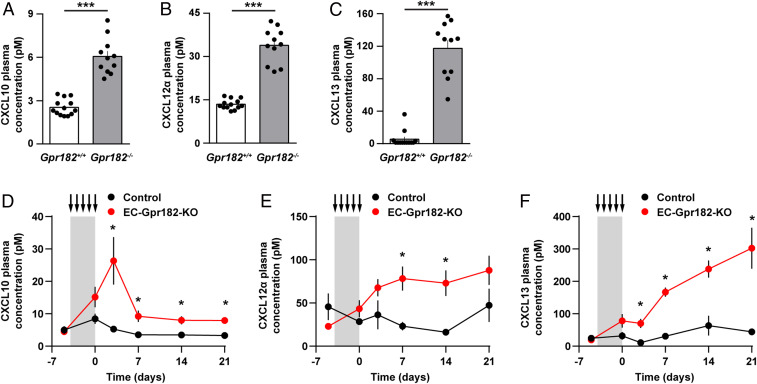
Fig. 4.
Increased free plasma concentrations of CXCL10, CXCL12α, and CXCL13 in mice lacking GPR182. (A–C) Plasma concentrations of CXCL10, CXCL12α, and CXCL13 in control Gpr182+/+ and GPR182-deficient mice (Gpr182−/−) (n = 11 to 13 mice per genotype). (D–F) Plasma concentrations of CXCL10, CXCL12α, and CXCL13 before as well as 1, 3, 7, 14, and 21 d after tamoxifen treatment on five consecutive days (arrows) in control mice and in EC-Gpr182-KO animals (n = 4 to 7 mice per genotype). Shown are mean values ± SEM; *P ≤ 0.05; **P ≤ 0.01; and ***P ≤ 0.001; n.s., nonsignificant [unpaired two-tailed Student’s t test (A–C) or multiple t test with Sidak correction (D–F)].

