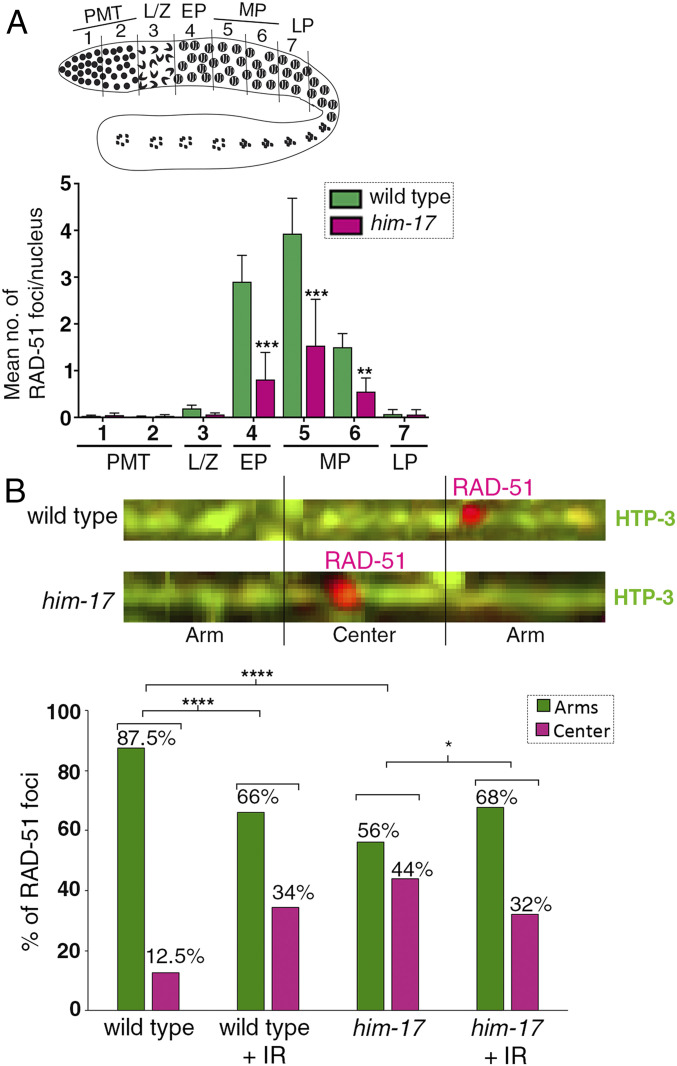
Fig. 3.
Quantification of RAD-51 foci and distribution on the chromosomes in wild type and him-17 mutants. (A) Schematic representation of a C. elegans germline indicating the different zones scored for the number of RAD-51 foci/nucleus. (Bottom) Histogram depicts the mean number of RAD-51 foci/nucleus observed in different zones of him-17 mutant germlines compared to wild type. X-axis shows the position along the germline. PMT: premeiotic tip (germ cells in mitosis), L/Z: meiotic nuclei in leptotene/zygotene stage, EP: meiotic nuclei in early pachytene, MP: meiotic nuclei in midpachytene, and LP: meiotic nuclei in late pachytene. The number of nuclei scored per zone is indicated in Dataset S1. ***P < 0.001 and **P < 0.02 by the two-tailed Mann–Whitney test, 95% CI. (B, Top) Representative images of linearized chromosomes costained with anti–HTP-3 (green) to trace chromosome axes and anti–RAD-51 (magenta) to mark DSB repair sites. Linearized chromosomes from pachytene nuclei were divided into three equal portions referred to as arms and center. Only chromosomes with clear start and end points were scored using PRIISM software as in (25). (Bottom) Histogram indicates the distribution of RAD-51 foci on the center versus the arm regions of the chromosomes in wild type, wild type + IR, him-17, and him-17 + IR. A total of 115, 33, 113, and 36 chromosomes from pachytene stage nuclei from the gonad arms of 35, 6, 33, and 6 animals were analyzed for wild type, wild type + IR, him-17, and him-17 + IR, respectively. ****P < 0.0001, *P < 0.024 by the two-tailed Fisher’s exact test.

