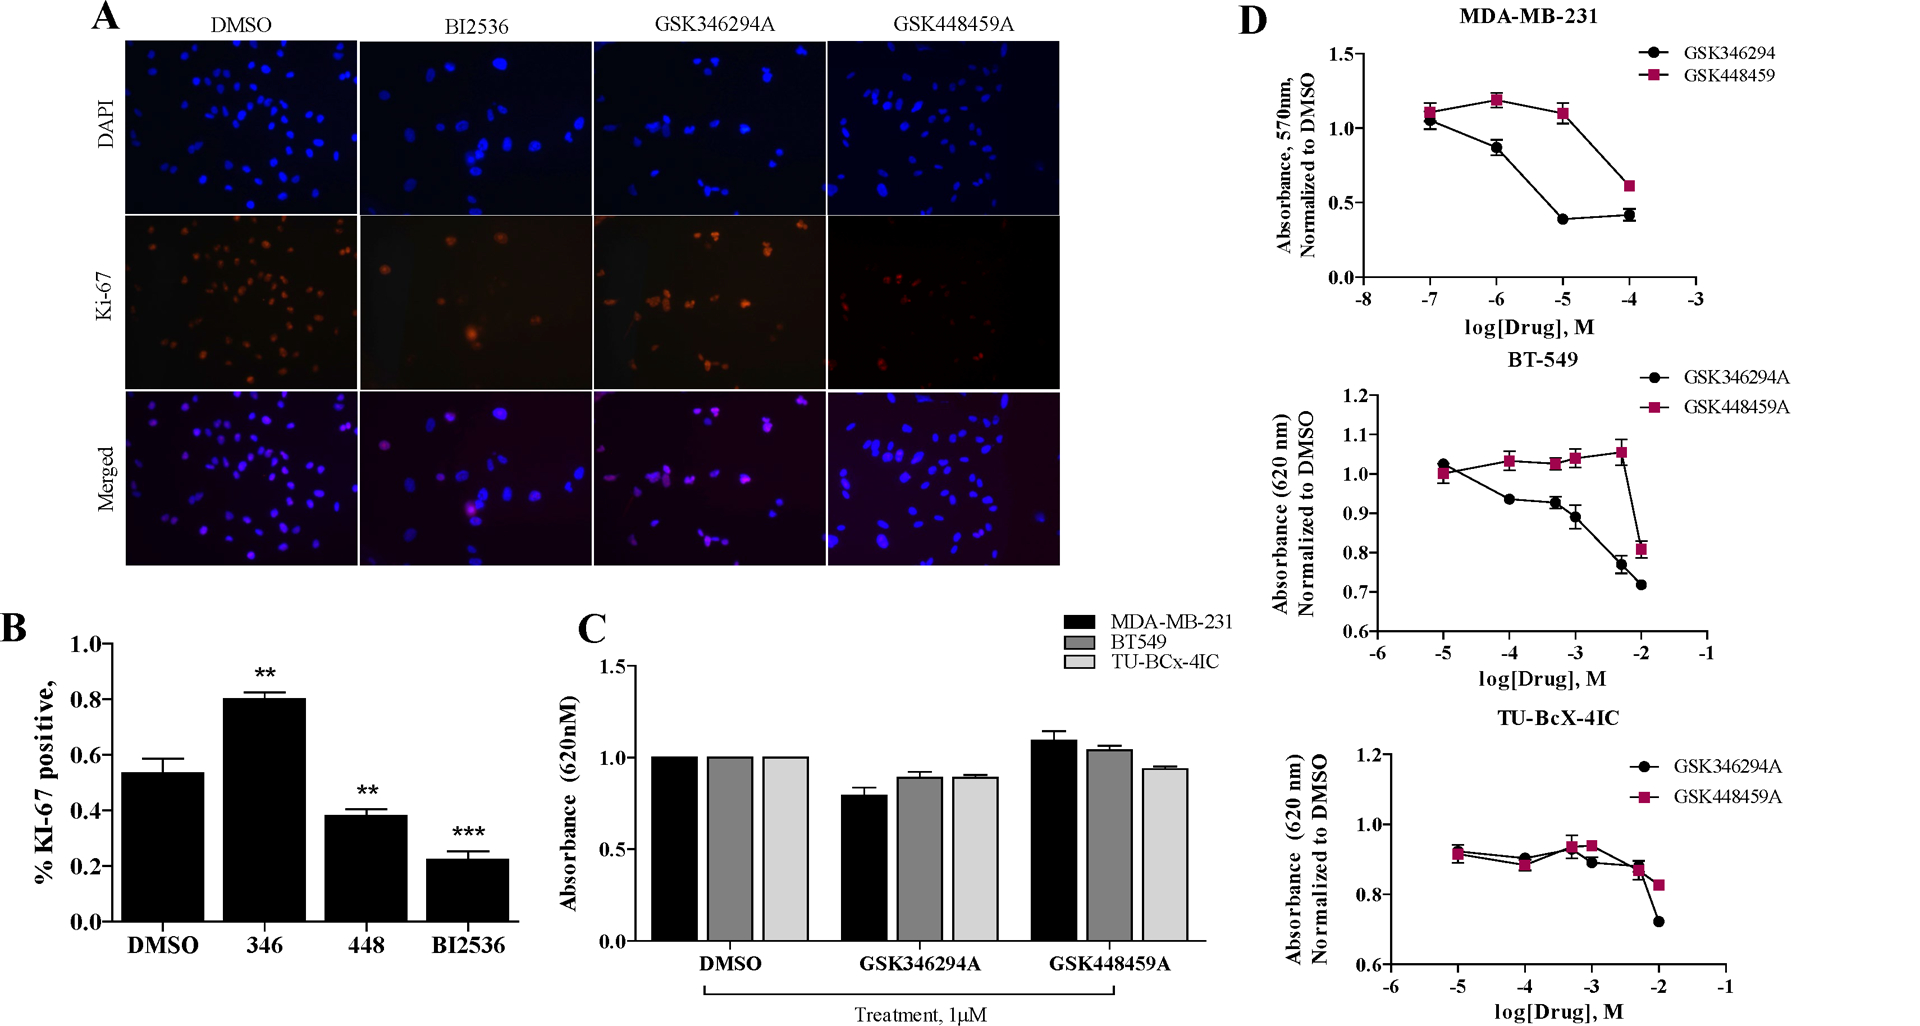
Figure 1. Differential effects of PKIS compounds on TNBC cell proliferation and viability.

(A) Immunofluorescence staining of MDA-MB-231 cells with Ki-67 after 72 hours treatment with PKIS compounds (GSK346294A, GSK448459A) at 1μM or DMSO control. Red = Ki-67, Blue = DAPI nuclear stain. Images were taken at 200X magnification. (B) Quantification of cell proliferation data. Percent of Ki-67 positive cells compared to total DAPI positive cells per image is shown. Error bars represent S.E.M. and significance is defined as * p < 0.05, *** p < 0.001. Abbreviations for inhibitors are GSK346294A (346), GSK448459A (448)). (C) Cell viability of TNBC cells (MDA-MB-231, BT549, TU-BcX-4IC) in response to PKIS inhibitors treated at1 μM for 72 hours compared to DMSO control. Cells were fixed, stained with crystal violet, lysed, and absorbance was measured (620 nm excitation). (D) Cell viability dose-response of TNBC cells (MDA-MB-231, BT549, TU-BcX-4IC) in response to PKIS inhibitors normalized to DMSO control. Error bars represent S.E.M.
