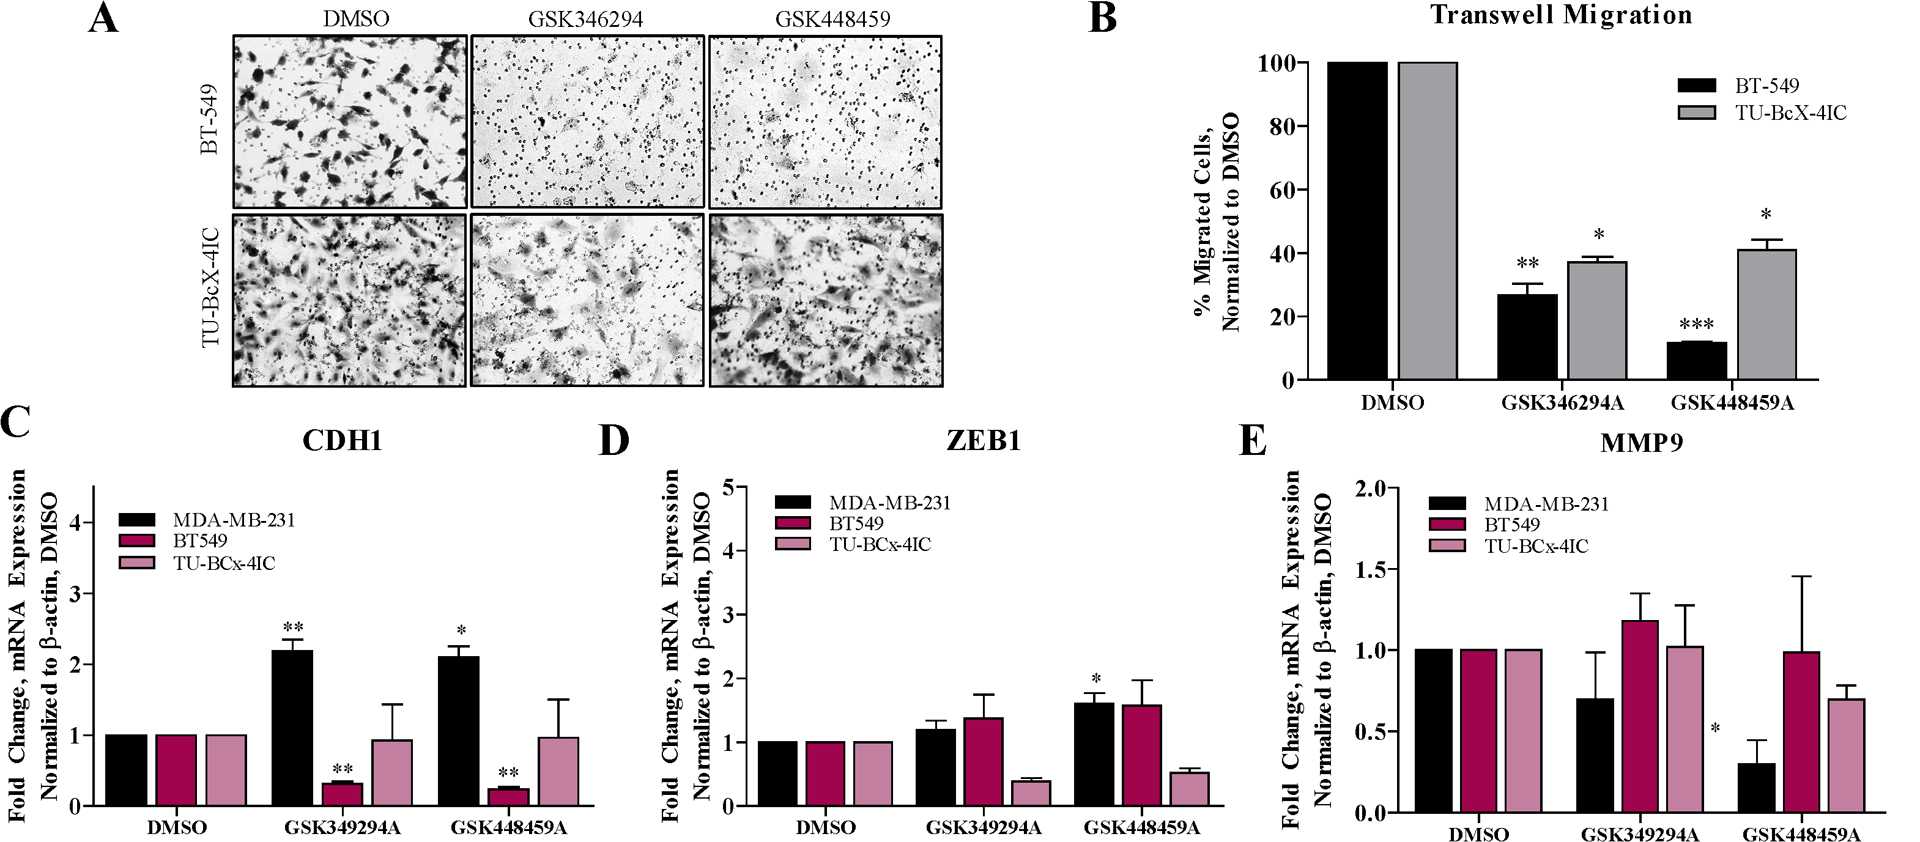
Figure 3. Comparison of PKIS inhibitors effects on transwell cell migration and mesenchymal gene expression.

(A) Transwell migration assay of BT549 and TU-BcX-4IC cells pretreated with PKIS compounds (1 μM) or DMSO controls for 72 hours. Representative images of migrated cells fixed and stained with crystal violet were captured with brightfield microscopy. (B) Quantification of crystal violet stained membranes from transwell migration assays using Image J software. Counted cells in the treatment groups were normalized to DMSO controls for each cell line. (C) CDH1, (D) ZEB1 or(E) cFOS gene expression changes induced by 72 hours treatment with PKIS inhibitors (1 μM) or DMSO treatments in TNBC cells (MDA-MB-231, BT549, TU-BcX-4IC) were evaluated using qRT-PCR. MDA-MB-231 cells had very low endogenous expression of TWIST, and gene expression analyses could not be performed. Error bars represent S.E.M. * p < 0.05, ** p < 0.01, *** p < 0.001.
