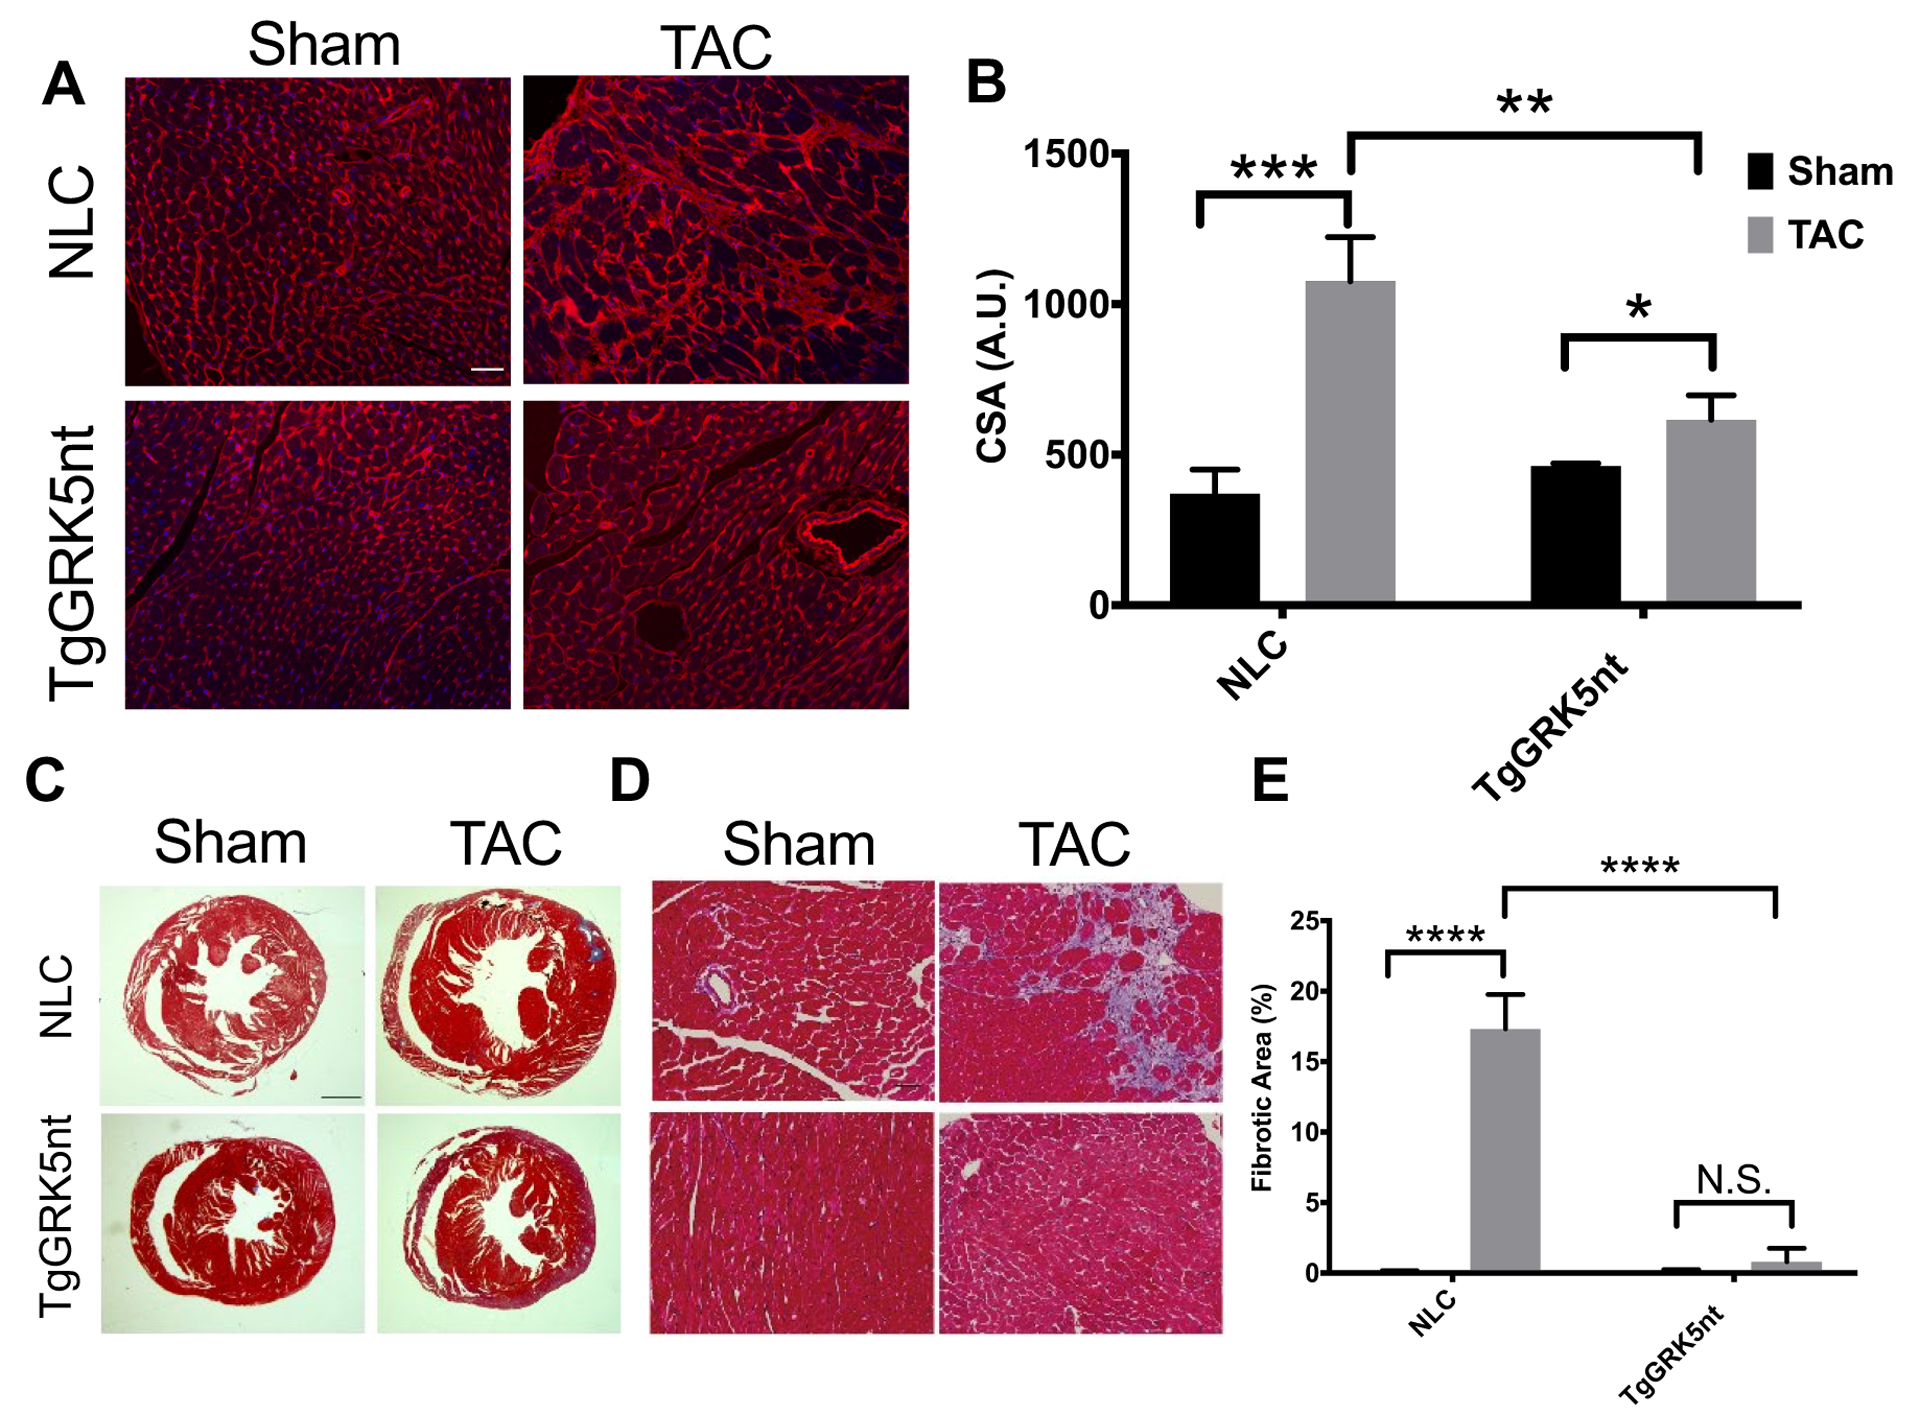
Fig. 2. Transgenic GRK5nt mice exhibit attenuated hypertrophy and fibrosis following chronic TAC.

(A) Wheat germ agglutinin staining of heart sections from NLC and TgGRK5nt mice. (B) Planimetric assessment of cell surface area from wheat germ agglutinin-stained sections. (C–E) Masson Trichrome staining of heart sections from NLC and TgGRK5nt mice following sham operation or TAC surgery (C and D). Fibrotic area was normalized to total field tissue area to derive relative fibrotic area (E). Scale bar in (A,D) 100μm, (C) 1000μm. N=10 NLC Sham mice, N=11 NLC TAC mice, N=7 TgGRK5nt Sham mice, N=7 TgGRK5nt TAC mice for (A) to (D). (* p<0.05, ** p<0.01, *** p<0.001, **** p<0.0001, two-way ANOVA with Tukey’s post-hoc testing for multiple comparisons in (B,E).
