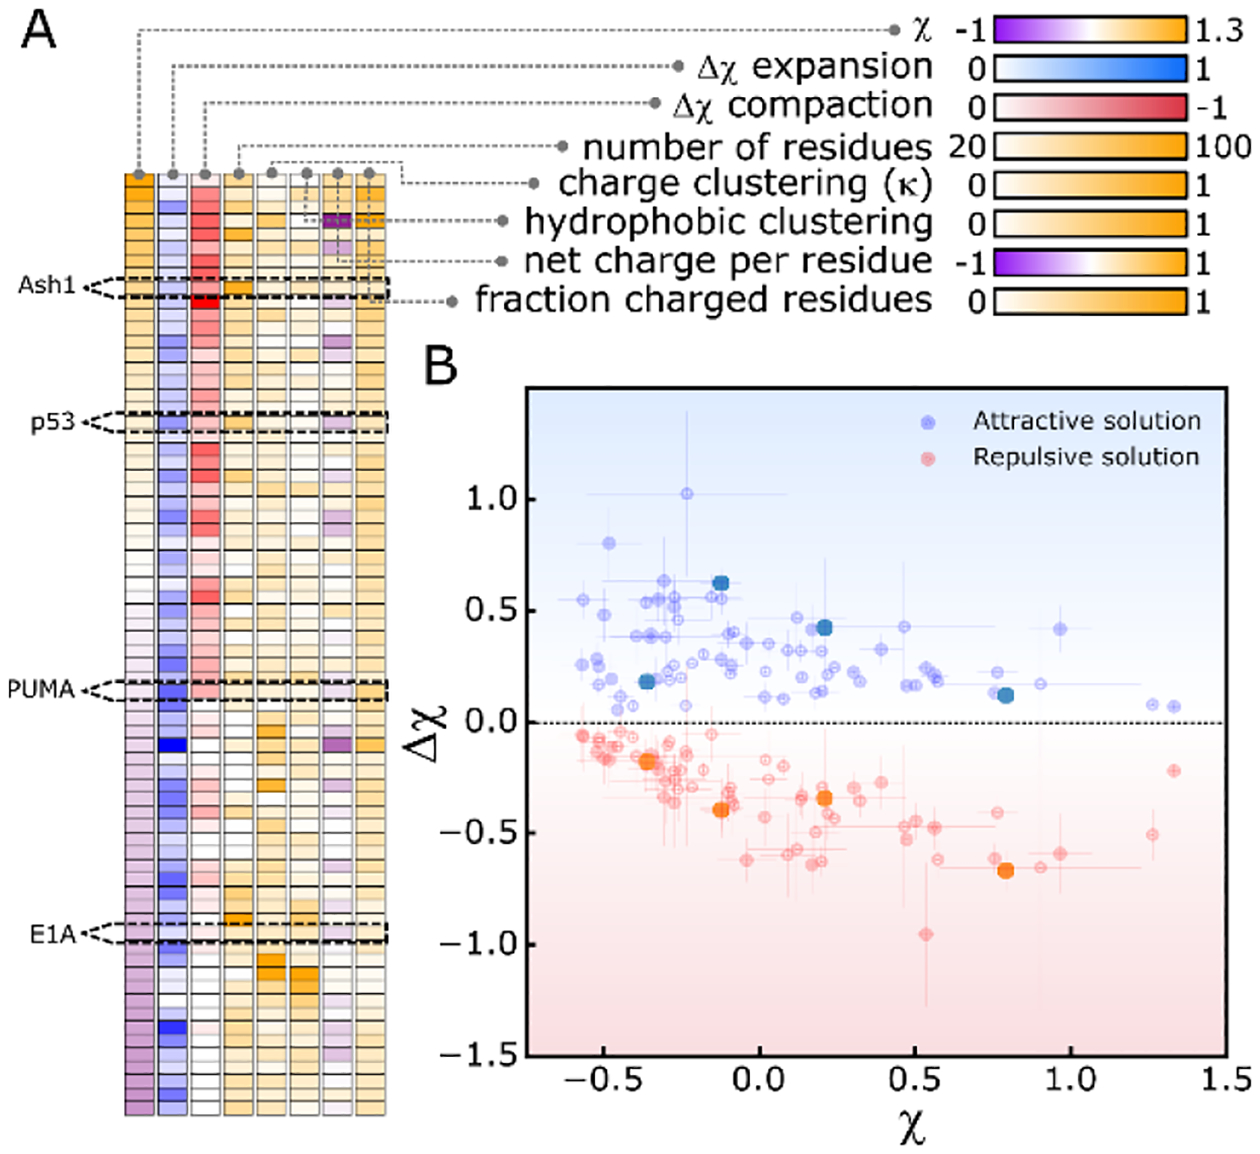
Figure 3.

All-atom simulations of IDR sensitivity to solutions. (A) Heatmap of protein sensitivity and molecular features for all 70 IDR sequences simulated. Protein identity varies from top to bottom across cells, and molecular features vary left to right. Color-maps are shown for each molecular feature. (B) The magnitude Δχ in attractive (blue) or repulsive (red) solutions as a function of χ in aqueous solution for each protein in (A). Error bars calculated from SD of 5 repeats. All data available in Table S3.
