Figure 2.
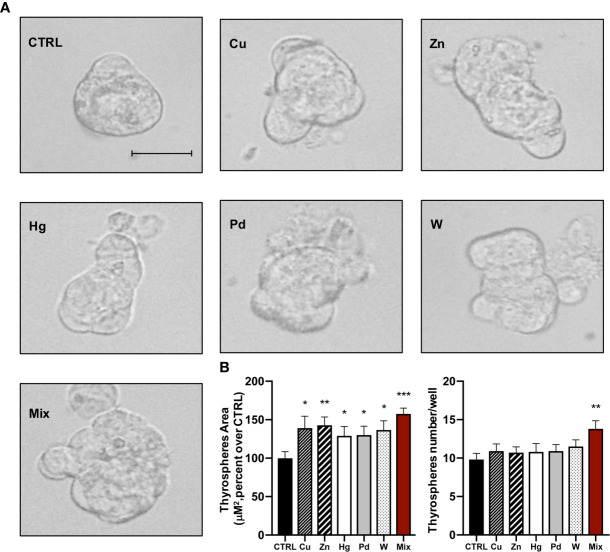
(A) Representative phase–contrast microscopy images of thyrospheres grown in standard medium (CTRL) or in medium added with each of the five heavy metals tested (at the salt concentration causing the maximum BrdU incorporation) or their mixture for 8 days (Scale bar: 30 μM). (B) Histograms indicate the mean value ± SEM of three separate experiments for measuring the size (μM2) and the number of thyrospheres after exposure to each metal or their mixture. *p < 0.05, **p < 0.01, ***p < 0.001 vs. CTRL.

