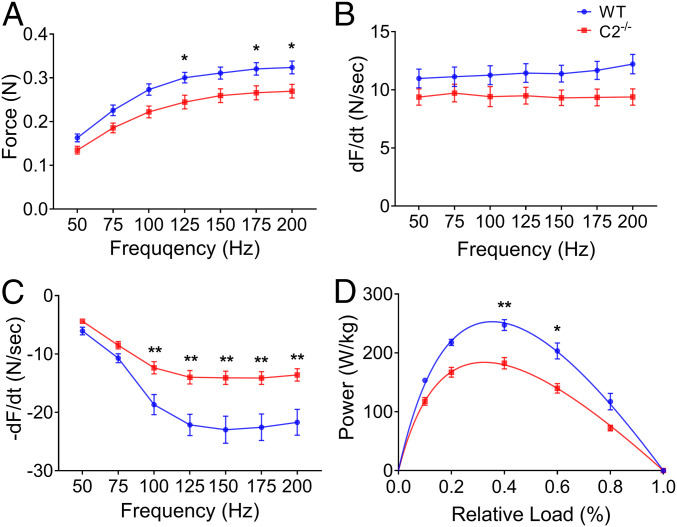
Fig. 2.
Force–frequency relationship and isotonic power generation of WT and C2−/− EDL muscles. (A) Escalated isometric tetanic force generation over increasing electrical frequency (50 to 200 Hz at 50 mA). Rates of (B) force development and (C) relaxation are depicted at given frequency. (D) Power generation of EDL muscle during isotonic muscle contraction at specific relative force (n = 5 to 9 in each group). Error bars represent ± SEM and *P < 0.05 and **P < 0.01 versus WT. Statistical analyses were performed in all groups by unpaired t test or ordinary two-way ANOVA followed by Bonferroni’s multiple comparison test.

