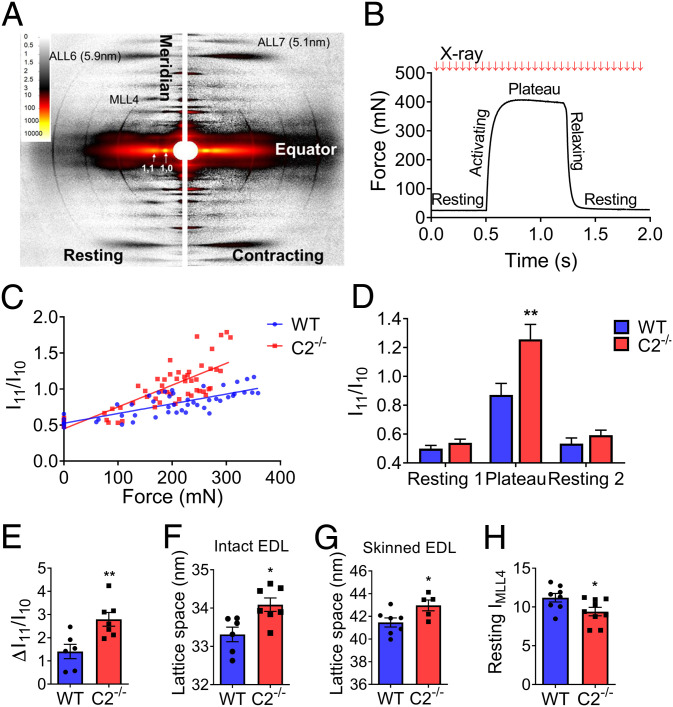
Fig. 4.
Increased sarcomere lattice spacing and disorganized myosin movement in C2−/− EDL intact muscles and skinned fibers. (A, Left) X-ray diffraction pattern of EDL muscle at rest (Right) and during contraction. Equatorial reflections (I11 and I10) and layer line patterns (MLL4, ALL6, and ALL7) are as indicated. (B) Force as a function of time during maximally activated isometric tetanus of EDL muscle. X-ray exposures (10 ms) were taken every 20 ms during isometric contraction. (C) Linear relationship of the ratio of I11 to I10 (I11/I10) to force development. Slope of I11/I10, as a function of force, is steeper in C2−/−. (D) Average I11/I10 during rest and maximal contraction. X-axis indicates resting (1 and 2) and plateau periods during the contraction as shown in Fig. 4B. (E) Change in I11/I10 relative to rest during isometric muscle contraction. (F) Calculated lattice spacings in intact EDL muscle at optimal muscle length (Lo) (G) and skinned EDL fibers at sarcomere length 2.2 µm. (H) Intensity of MLL4 in resting EDL muscle (n = 6 to 9 in each group). Error bars represent ± SEM, *P < 0.05 and **P < 0.01. Statistical analyses were performed in all groups by unpaired t test or ordinary two-way ANOVA followed by Bonferroni’s multiple comparison test.

