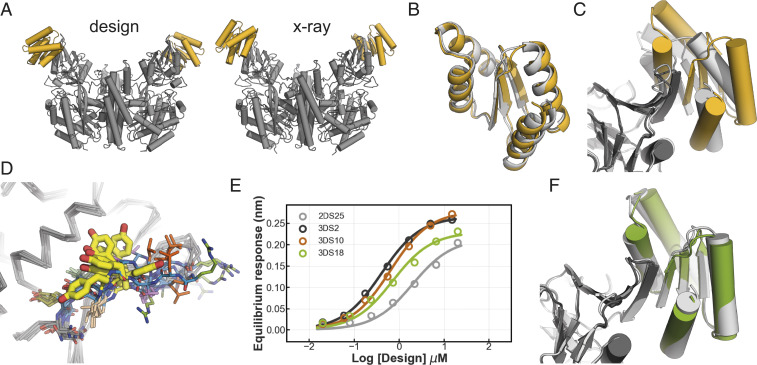
Fig. 3.
Structural analyses of 2DS25 complexes. (A) Overview of the designed model and crystal structure (gray: hTfR, yellow: 2DS25). (B) Superposition 2DS25.5 (yellow) and the designed model (light gray). (C) Superposition of the 2DS25.5-hTfR crystal structure (dark gray and yellow) and designed model (light gray) at the interface. (D) Overlay of hTfR ectodomain structures in the PDB (1cx8, 1de4, 1suv, 3kas, 6d04, 3s9l, 6h5i, 6wrv, and 6wrv). Edge strand backbones are colored in blue. Tyr211 is shown in thick yellow sticks. (E) Equilibrium binding curves 2DS25 and the designs 3DS2, 3DS10, and 3DS18. (F) Overlay of the crystal structure 3DS18 in complex with hTfR (green and dark gray) and the designed model (light gray).

