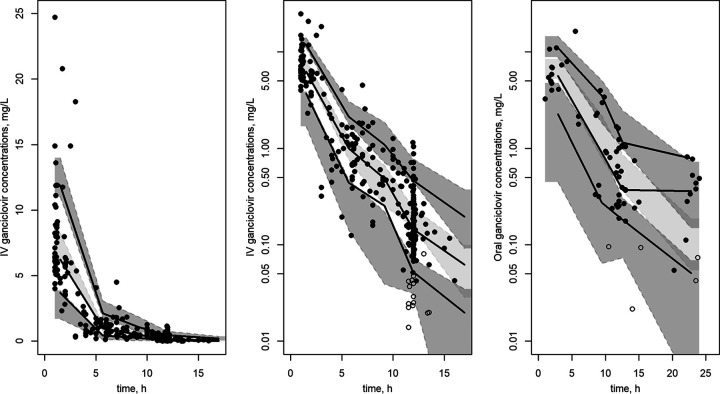
FIG 2.
Prediction-corrected visual predictive check for i.v. (linear scale on the left and log-linear scale in the middle) and oral (right) administration. Colored areas represent 95% CIs of 5th, 50th, and 95th simulated percentiles. Lines are empirical (observed) 5th, 50th, and 95th percentiles. Dots are observed data. Full and empty circles are the noncensored and censored data, respectively.

