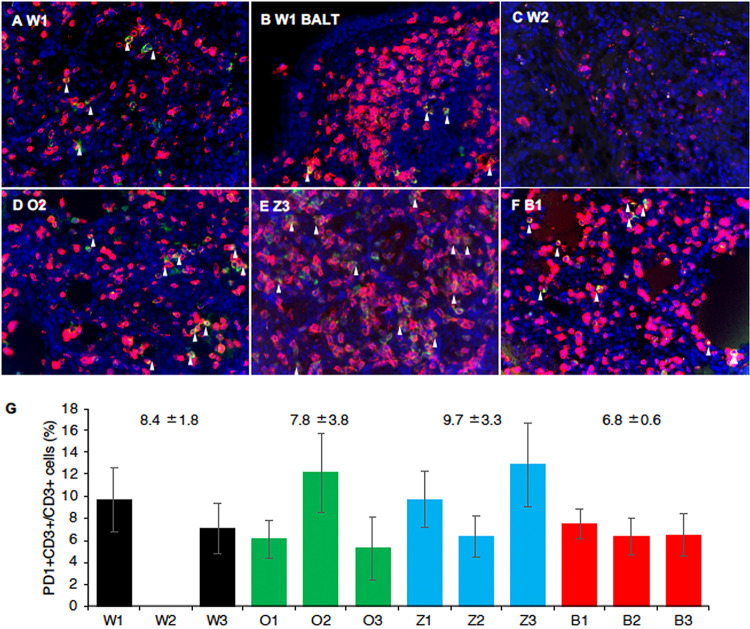
FIG 5.
Infiltration of PD1+ CD3+ T lymphocytes in the lungs of macaques after H7N9 HPAIV infection. (A to F) PD-1 and CD3 were stained on lung tissue sections. (A and C to F) Lung parenchyma; (B) BALT. (A and B) W1, autopsied on day 8; (C) W2, autopsied on day 3; (D) O2; (E) Z3; (F) B1, autopsied on day 8. Green, PD1; red, CD3; blue, nuclei (DAPI) imaged with a 40 × lens objective. White arrowheads show representative PD-1+ CD3+ cells. (G) PD-1+ CD3+ cells in lung tissues of each macaque. Black, DW group; green, oseltamivir group; blue, zanamivir group; and red, baloxavir group. Averages and standard deviations of the percentages of PD-1+ CD3+ cells in 5 images of lung parenchyma tissue sections in individual macaques are shown. Numbers above the bars are averages and standard deviations for two macaques (DW group; W2 was autopsied on day 3) or three macaques (oseltamivir, zanamivir, and baloxavir groups). No statistically significant differences were found among the groups (P > 0.05; Mann-Whitney U test).

