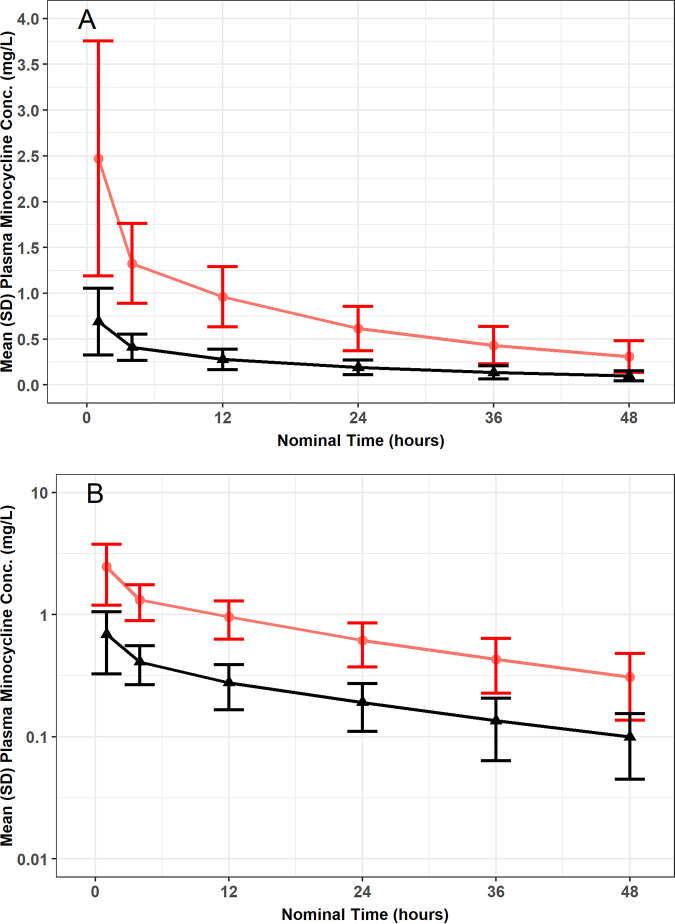
FIG 1.
Mean ± SD of the observed total and unbound plasma minocycline concentration-time data following a single i.v. infusion of 200 mg minocycline over 1 h to critically ill patients, presented on a linear (A) and semilog (B) scale. Red lines are total minocycline concentrations, and black lines are unbound minocycline concentrations.

