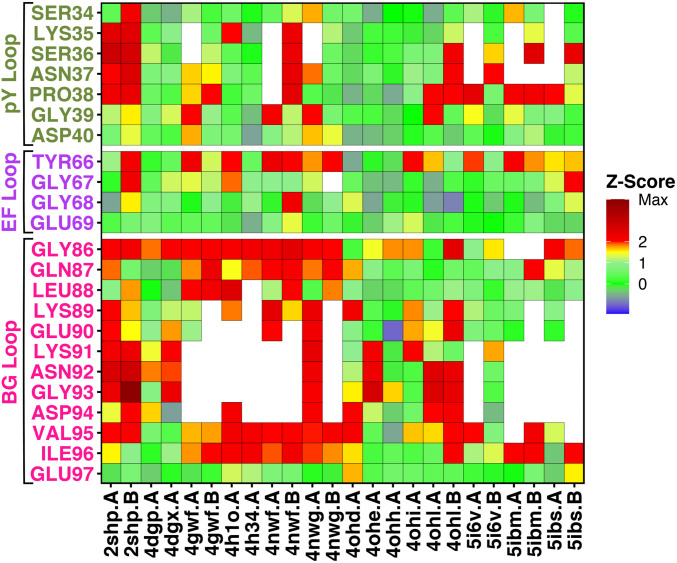
Fig. 3.
Tile plot of the R-factor Z-scores, calculated for crystal structures of autoinhibited SHP2. Z-scores are reported in color scale for each residue (blank spaces indicate missing residues), belonging to functionally important loop regions, corresponding to the pY loop (Ser34–Asp40, dark green), the EF loop (Tyr66–Glu69, purple) and the BG loop (Gly86–Glu97, pink).

