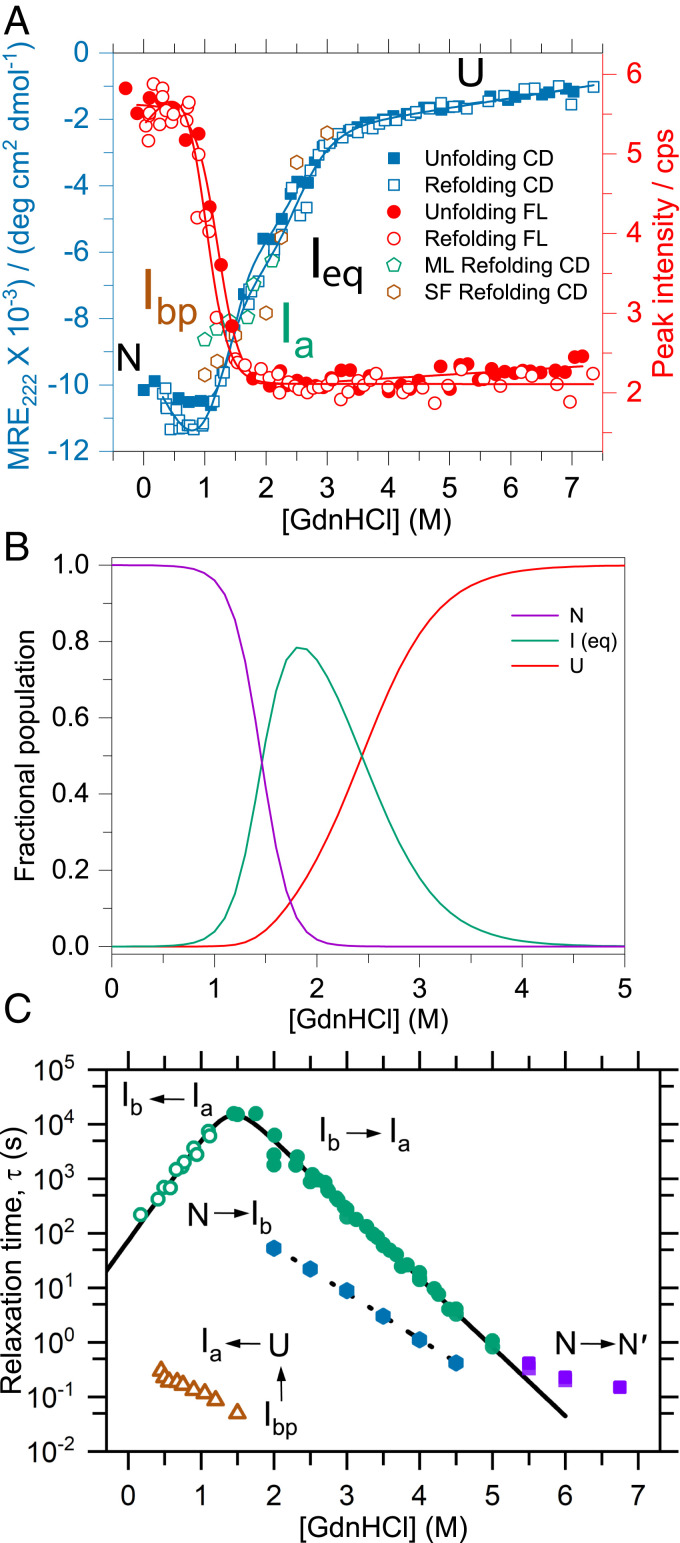
Fig. 1.
Thermodynamic and kinetic folding properties of TmIGPS. (A) Titration curves are shown after 9 d equilibration in GdnHCl (SI Appendix, Fig. S2) and were fitted to a three-state CD model (blue) and a two-state FL model (red). A large burst phase was seen after 10 s for the on-pathway intermediate, Ia, in manual (green) and after 10 ms for the off-pathway intermediate, Ibp, in stopped-flow (brown) refolding CD experiments at different GdnHCl concentrations. (B) The fractional population plot is based on thermodynamic parameters extracted from a fit of the CD data to an apparent three-state model (SI Appendix, Table S1). (C) A semilog plot of the relaxation times, τ, acquired from unfolding (filled symbols) and refolding (open symbols) experiments is plotted against final GdnHCl concentration. The solid line for slow unfolding and refolding phases is a fit to a two-state chevron model (53). The assignments of the phases to specific steps in the mechanism are indicated.

