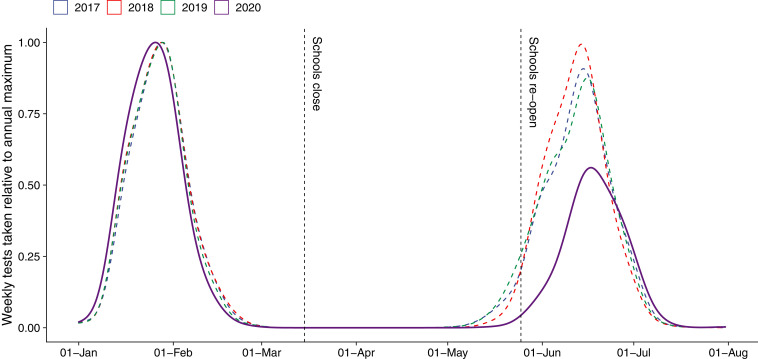
Fig. 1.
Distribution of testing dates 2017 to 2020 and timeline of 2020 school closures. Density curves show the distribution of testing dates for national standardized assessments in 2020 and the three comparison years 2017 to 2019. Vertical lines show the beginning and end of nationwide school closures in 2020. Schools closed nationally on March 16 and reopened on May 11, after 8 wk of remote learning. Our difference-in-differences design compares learning progress between the two testing dates in 2020 to that in the 3 previous years.

