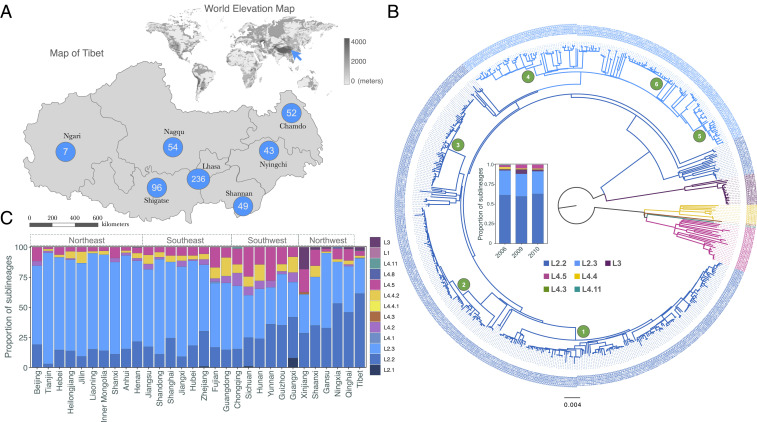
Fig. 1.
Genetic structure of Tibetan Mtb population. (A) The numbers of Mtb isolates that were sampled from different municipal regions in Tibet; the blue arrow in the world elevation map refers to the location of the Tibetan Plateau. (B) A maximum likelihood phylogenetic tree of 576 Tibetan Mtb strains; the bar plot in the middle showed the constitutions of different sublineages for each of the 3 y. The branches of the tree were colored according to the sublineages, and the annotated numbers (1–6) refer to the Tibetan clades in Fig. 2. (C) Population structure of Mtb strains in 30 provinces of China; the data for other provinces were from a previous countrywide genotyping study (14).

