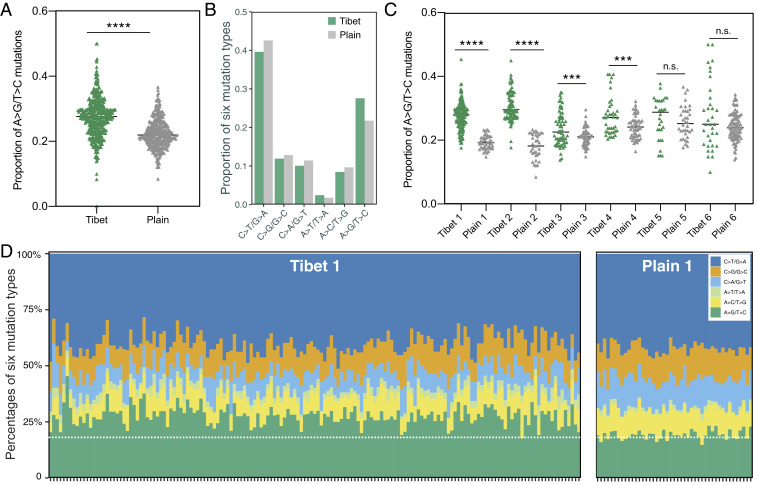
Fig. 4.
Tibetan Mtb strains had higher ratio of A > G/T > C mutations. (A) Comparison of the ratio of A > G/T > C mutations between Tibetan strains and plain strains. (B) The proportion of six mutation types in all mutations from Tibet and plain strains, respectively. (C) Comparison of the ratio of A > G/T > C mutations between each Tibetan clade and the relative plain clade. (D) A bar plot showing the mutational composition for each individual strain from Tibet 1 and plain clades; the dashed white line indicates the mean level of A > G/T > C mutations in the plain group. ****P < 0.0001 and ***P < 0.001; n.s. refers to no significance (given by t test).

