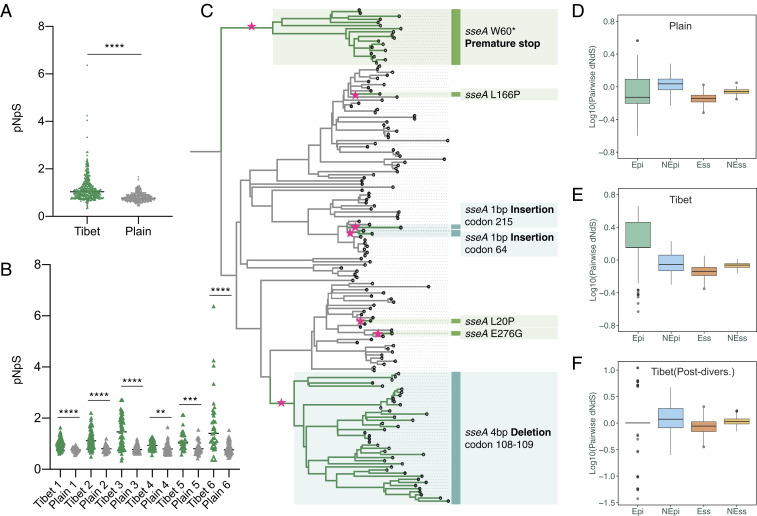
Fig. 5.
Local adaptation of Tibetan Mtb strains. (A) Comparison of pNpS ratio for mutations accumulated by Tibetan and plain strains; each dot represents one Mtb isolate. (B) Comparison of pNpS ratio between each Tibetan clade and the relative plain clade. (C) A maximum likelihood phylogenetic tree for Tibet 1 clade with the mutational events of sseA highlighted. Each pink star represents where the relative mutation was accumulated. (D–F) Comparison of pairwise dNdS ratio of Epi, NEpi, Ess, and NEss; Tibet (Post-divers.) refers to the comparison that only considered the mutations accumulated after local diversification. ****P < 0.0001, ***P < 0.001, and ***P < 0.01; n.s. refers to no significance (given by t test).

