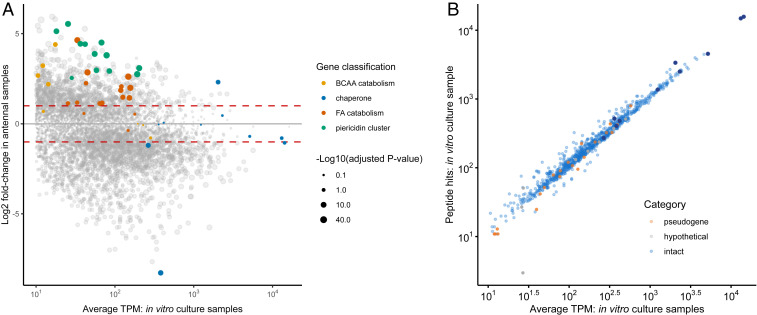
Fig. 6.
Gene expression in vitro and in the antennal reservoirs. (A) Comparison of gene expression in in vitro cultures versus antennal samples. Genes in the piericidin biosynthetic cluster are indicated in green, genes in fatty acid (FA) catabolism are indicated in orange, genes involved in branched-chain amino acid (BCAA) catabolism are in yellow, and molecular chaperones are in blue. Other genes are presented in gray. The area of the dots is proportional to -Log10(q-value). Only coding sequences with TPM values > 10 are displayed. Dashed red lines indicate fold change = +/− 2. (B) Correlation between proteome and transcriptome data. Peptide hits to identified proteins were used as an estimate of relative protein abundance to contrast with average TPM values of the corresponding coding sequences from in vitro culture samples. Intact genes are shown in blue, pseudogenes are shown in orange, and hypothetical proteins are shown in gray. Molecular chaperones are highlighted in dark blue. Coding sequences with TPM values < 10 or not detected experimentally in the proteome are not shown.

