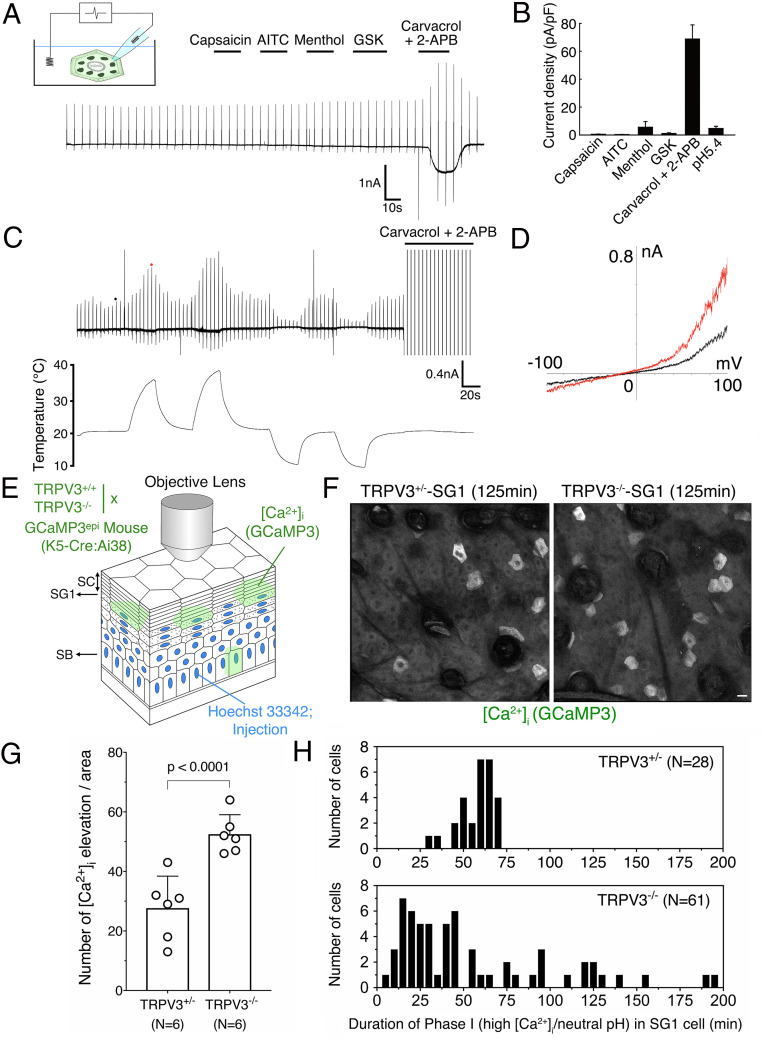
Fig. 4.
TRPV3 regulates the [Ca2+]i elevation and intracellular acidification timing occurred in SG1 cells. (A) A representative membrane current trace from whole-cell patch-clamp recordings in isolated SG1 cells is shown. Large currents were observed upon stimulation with TRPV3 activators (250 μM carvacrol and 100 μM 2-APB) but not with TRPV1 (1 μM capsaicin), TRPA1 (100 μM AITC), TRPM8 (100 μM menthol), or TRPV4 agonists (0.5 μM GSK1016790A) (n = 6). (B) The peak current density was increased by TRPV3 channel activators (n = 4 to 6) and not by a pH 5.4 (n = 2). (C) A representative membrane current trace of changes in temperature in isolated SG1 cells. Large currents were observed upon warm stimulation (n = 4). After two rounds of warm stimulation, an SG1 cell was stimulated with 250 μM carvacrol and 100 μM 2-APB (The peak current was out of range because the current was too large). (D) Current–voltage relationship of warm temperature–evoked currents is shown in the Right graph. The black and red dots in trace C indicate points where current–voltage curves were generated. (E) A schematic illustration of intravital GCaMP3 imaging in TRPV3−/− mice. Time-lapse images of GCaMP3 and Hoechst 33342 were obtained at 5 min intervals for 305 min. The scanned plane containing SG1 cells is indicated by an arrow. (F) Representative images of TRPV3+/− and TRPV3−/− SG1 cells obtained from GCaMP3epi mice at the 125 min time point of intravital imaging. Notably, the number of SG1 cells exhibiting increased GCaMP3 signals were increased in TRPV3−/− SG1 cells (scale bar, 20 µm). See also SI Appendix, Fig. S4 and Movie S7. (G) The number of cells exhibiting elevation in [Ca2+]i is shown in the bar graph. Time-lapse images of five different areas of TRPV3+/− (n = 6) or TRPV3−/− (n = 6) epidermis were obtained via confocal microscopy and analyzed. The number of SG1 cells exhibiting increased [Ca2+]i was counted. TRPV3−/− SG1 cells showed an increased elevation in [Ca2+]i. (H) The number of cells was plotted against the duration time of phase I (high [Ca2+]i-neutral pHi) for TRPV3+/+ (n = 28) or TRPV3−/− (n = 61) SG1 cells.

