Fig. 1.
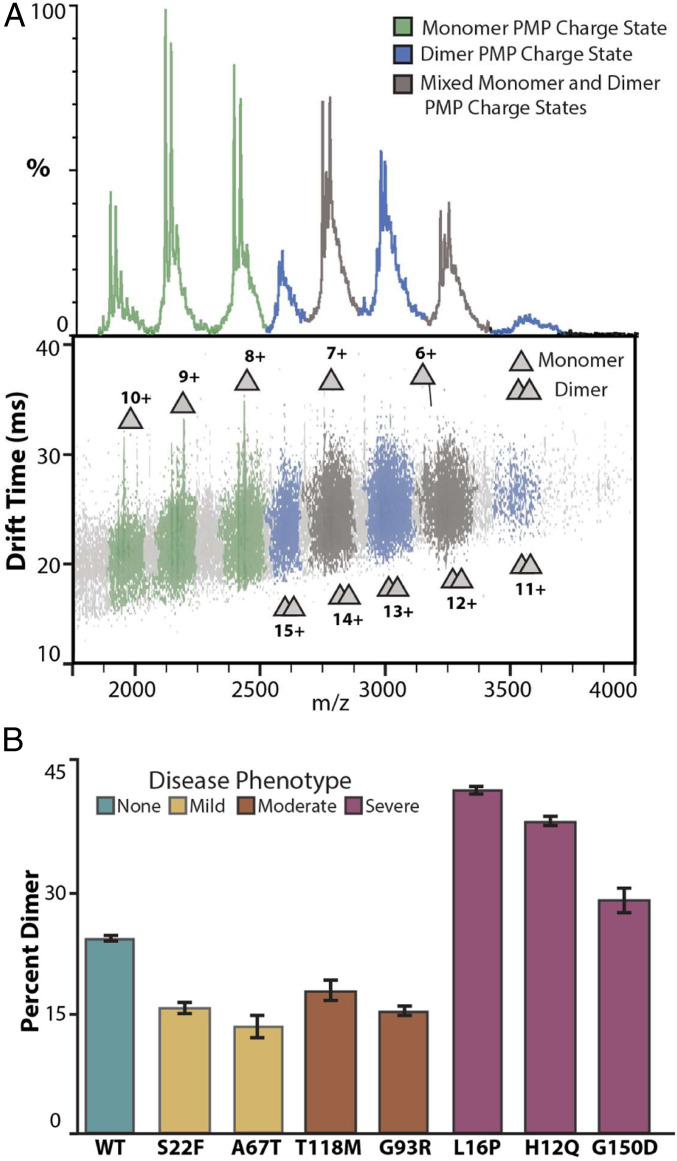
Native IM-MS of PMP22 reveals differences in dimeric abundances. (A) Mass spectra and IM-MS data set of PMP22 liberated from detergent micelles produces populations of monomer and dimer protein at charge state ranges of 6 to 10+ and 11 to 15+, respectively. Charge states were identified as containing only monomer (green), only dimer (blue), or a mix of monomer and dimer (gray). (Trap = 80 V, exponential intensity scale for IM-MS dataset). (B) Intensities for PMP22 signals identified as monomer or dimer were used to calculate the percent dimer in WT PMP22, as well as seven mutant PMP22 variants, n = 3, SD shown as error bars. Notably, L16P, H12Q, and G150D mutants correlated with severe disease phenotypes and exhibit significantly more dimer (41.0 ± 0.4%, 37.3 ± 0.6%, 28.1 ± 1.5%) than WT (23.2 ± 0.3%).

