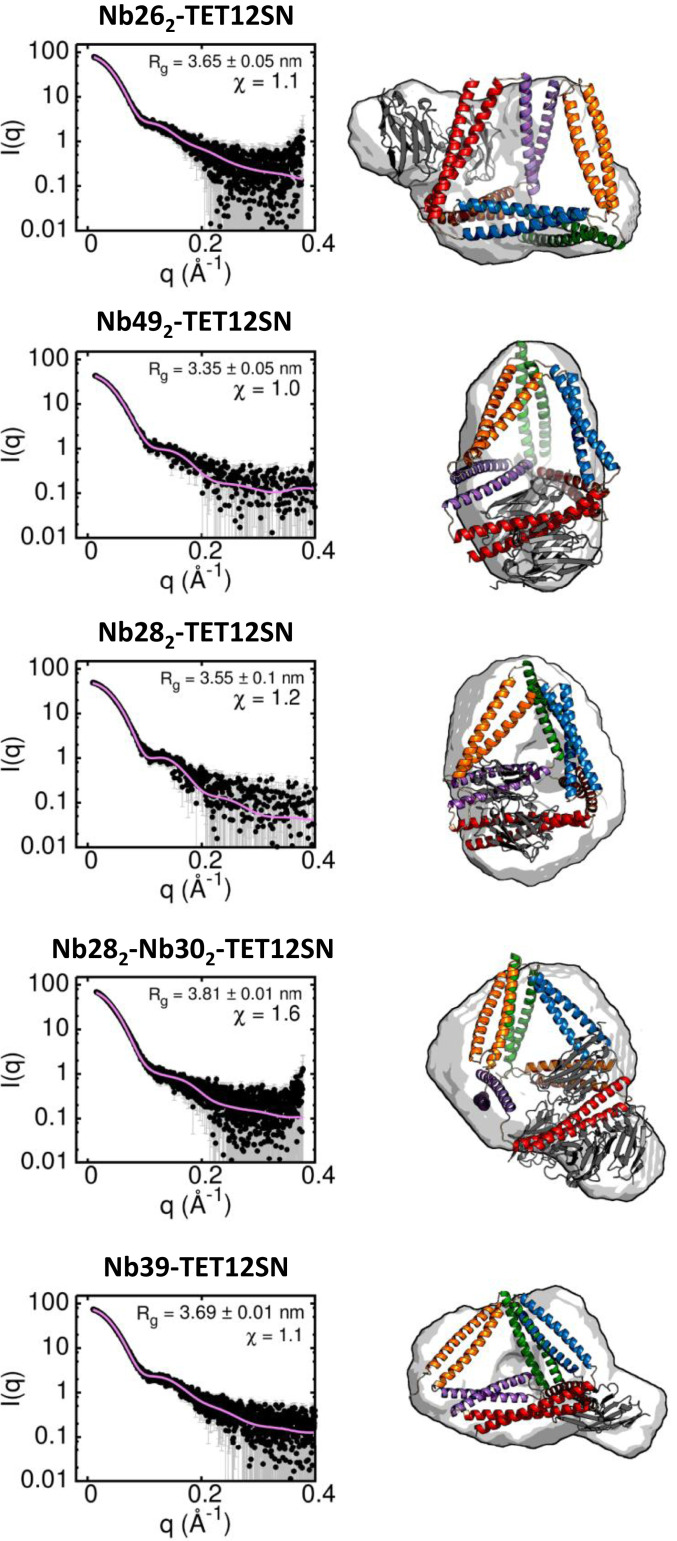
Fig. 6.
Structural analysis of the nanobody-TET12SN tetrahedron complexes using SAXS. (Left) Experimental SAXS profiles (black dots) together with theoretical scattering calculated from best-fitting model complex structures (pink curve). (Right) The best fit models of a complex with their corresponding molecular envelopes obtained by ab initio reconstruction. Nanobodies are shown in gray, and the CC segments in TET12SN are colored according to the color legend in Fig. 1A.

