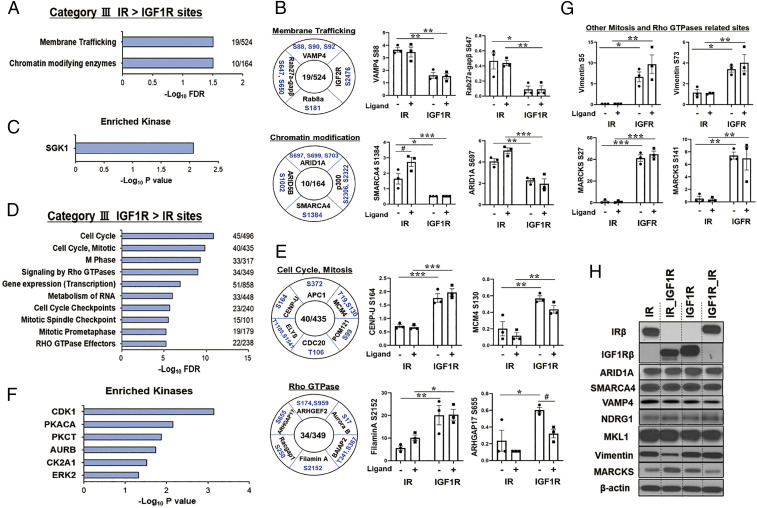
Fig. 5.
Proteins differentially phosphorylated in cells expressing IR versus IGF1R in the unstimulated (basal) state. (A) REACTOME pathway enrichment analysis of phosphosites in the IR > IGF1R cluster (category IIIA). Plots are –log10 transforms of enrichment FDR value. (B) Representation of some important phosphosites in selected pathways, and quantification of exemplary phosphosites in the cluster of category IIIA. Numbers in the center indicate number of proteins regulated within each pathway. Data are means ± SEM of phosphosites intensity values. #P < 0.05 basal vs. ligand, *P < 0.05, **P < 0.01, ***P < 0.001 IR vs. IGF1R, two-way ANOVA. (C) Kinase enrichment analysis of phosphosites in category IIIA. Plots are –log10 transforms of enrichment P value. (D) REACTOME pathway enrichment analysis of phosphosites in the IGF1R basal > IR basal cluster (category IIIB). Plots are –log10 transforms of enrichment FDR value. (E) Representation of some important phosphosites on selected pathways, and quantification of exemplary phosphosites in category IIIB. Data are means ± SEM of phosphosites intensity values. #P < 0.05 basal vs. ligand, *P < 0.05, **P < 0.01, ***P < 0.001 IR vs. IGF1R, two-way ANOVA. (F) Kinase enrichment analysis of phosphosites in category IIIB. Plots are –log10 transforms of enrichment P value. (G) Quantification of exemplary phosphosites of vimentin and MARCKS which are secondary downstream targets of Rho GTPases signaling and cell cycle and mitosis. *P < 0.05, **P < 0.01, ***P < 0.001 IR vs. IGF1R, two-way ANOVA. (H) Immunoblotting of total protein levels for ARID1A, SMARCA4, VAMP4, NDRG1, MKL1, vimentin, and MARCKS in lysates from cells expressing IR, IR_IGF1R, IGF1R, and IGF1R_IR.

