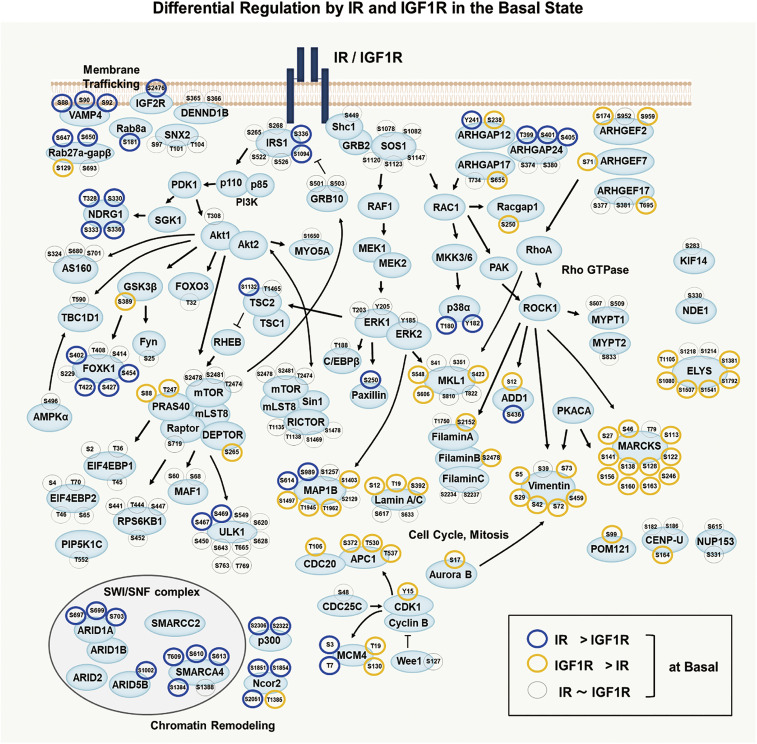
Fig. 6.
Integrated map showing altered signaling in cells expressing IR vs. IGF1R in the basal state. Diagram of intracellular signaling networks regulated by IR and IGF1R in the basal state as identified by phosphoproteomics. Each of the indicated phosphosite was analyzed by two-way ANOVA. Blue and yellow halos represent sites increased in cells expressing IR versus IGF1R, respectively, in the basal (nonstimulated) state, which were significantly different at the P < 0.05 level. Arrows indicate protein–protein interactions and phosphorylation/dephosphorylation events curated from databases of experimentally defined kinase–substrate relationships (PhosphositePlus) and the literature.

