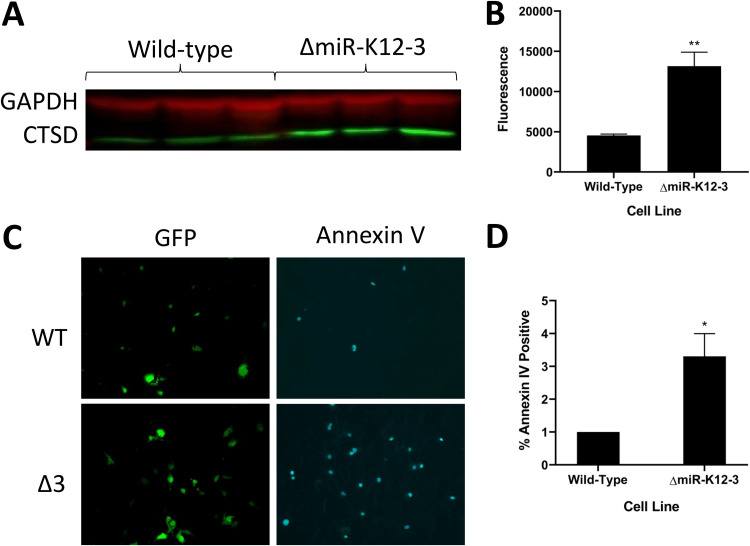
FIG 7.
Cells infected with ΔmiR-K12-3 show higher cathepsin D expression and increased apoptosis compared to WT-infected cells. (A) Representative image of a Western blot comparing CTSD protein levels in WT-infected and ΔmiR-K12-3-infected TIVE cells. Three biological replicates are shown for each condition. (B) Quantification of CTSD protein levels. Western blots using fluorescently tagged secondary antibodies were photographed on a Li-Cor instrument and fluorescence was quantified. The graph shows the average from three replicates, normalized to GAPDH. Error bars show standard errors. (C) Representative images of WT- and ΔmiR-K12-3-infected TIVE cells with Alexa Fluor 647-labeled annexin V. GFP indicates normal cells. (D) Quantification of annexin V micrographs. The percentage of annexin V-positive cells was calculated for each microscope field. Results are averages from four independent experiments consisting of three replicates per treatment. Error bars represent standard errors. P values versus WT by 2-tailed Student’s t test: *, P ≤ 0.05; **, P ≤ 0.01; ***, P ≤ 0.001.

