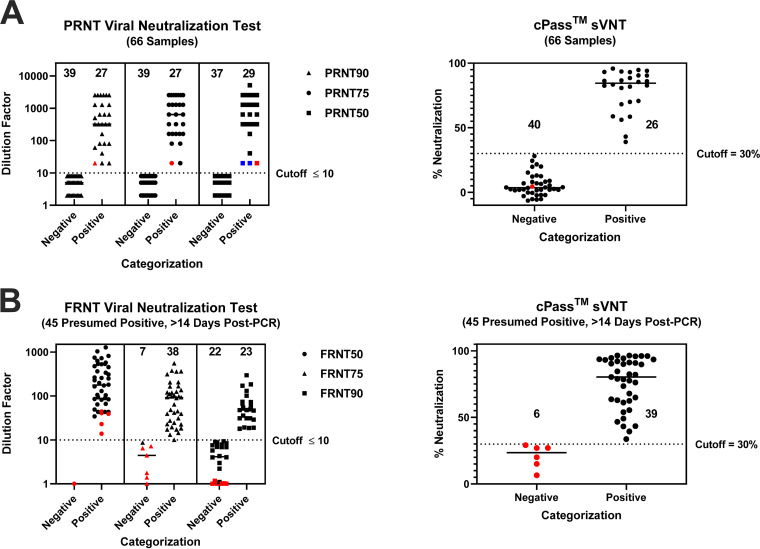
FIG 3.
Direct comparison between the PRNT, FRNT (at different analysis stringencies), and sVNT. (A) PRNT. Sixty-six samples were assayed between the PRNT50, PRNT75, PRNT90, and sVNT. One sample was discordant between the sVNT and the PRNT75 and PRNT90 (red dot). Two samples were discordant between the PRNT50 and PRNT75 (blue dots). For the PRNT, negative samples with values below 10 were randomly assigned values of 2, 5, or 8 to more easily visualize the number of negative samples. (B) FRNT. Forty-five presumed positive samples were tested between the FRNT50, FRNT75, and FRNT90 and the sVNT. The same six samples were categorized as negative by the sVNT, FRNT75, and FRNT90 (red dots). One sample was discordant between the FRNT75 and sVNT. For the FRNT, all samples with a value of zero were assigned a value of 1 to more easily visualize the negative samples.

