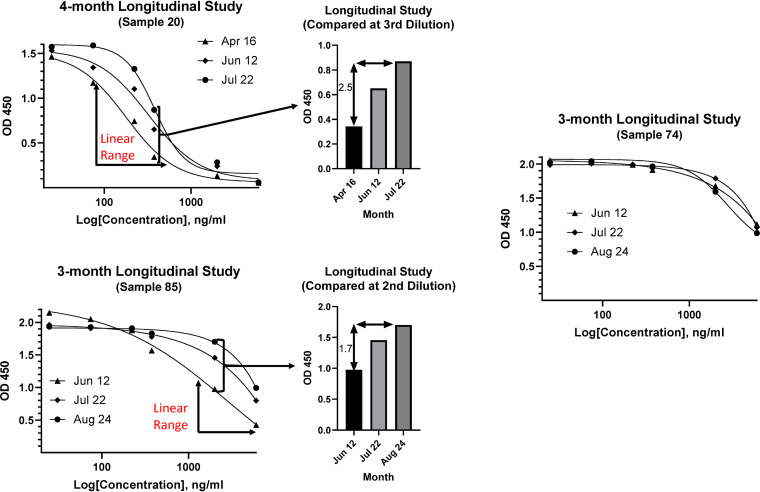
FIG 4.
Longitudinal assessment of viral titers by the cPass sVNT for serum samples taken at different time points postinfection. Samples were initially diluted 1:10 according to the kit instructions and then serially diluted 1:3 for an additional five dilutions to generate a competition curve for each sample at each time point. Samples 20 and 85 were compared for titers within the linear range of each curve or by the OD450 ratio.

