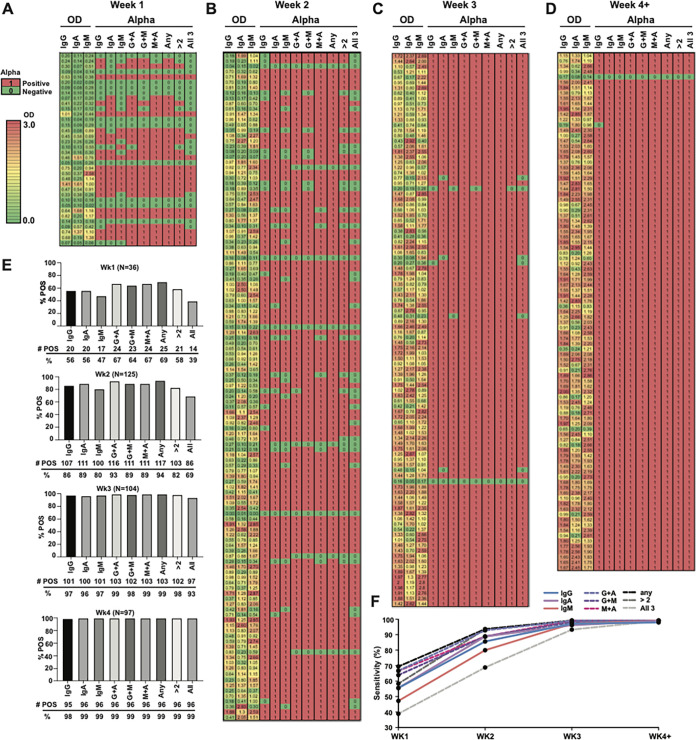
FIG 3.
Sensitivity of antibody class-specific SARS-CoV-2 serology increases over time after symptom onset with an associated rise in the OD reading and alpha response. (A to D) OD values of 362 samples from 54 individuals for whom reliable symptom onset information could be obtained by chart review divided by week after symptom onset into heat maps. The far left of each heat map shows the OD value result for each serology test performed. To the right is the alpha response for each test using the OD cutoffs for each assay determined in Fig. 1 (0.2 for IgG, 0.15 for IgA, and 0.35 for IgM), followed by different combinations of testing (G+A, G+M, M+A, any, >2 tests, or all tests). (E) Percent positivity of the samples plotted for each of the weekly heat maps and for each individual test or testing combination. (F) Sensitivity of each individual test or testing combination plotted over weeks after symptom onset. The specificity for each assay was determined by testing 131 historical negative samples and is listed for each cutoff in Fig. 1A to C.

