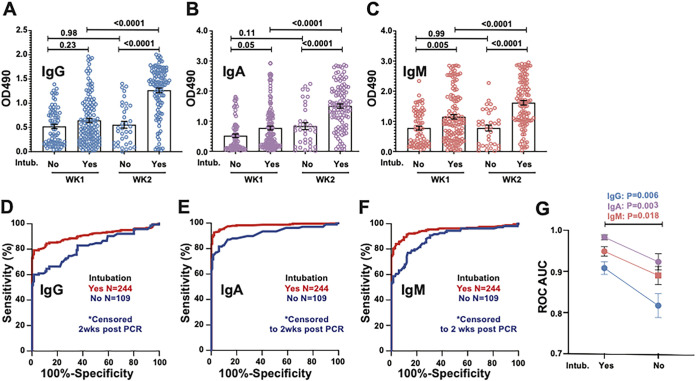
FIG 5.
Analysis of assay performance and OD values in samples from COVID-19 patients requiring intubation. (A to C) Plotted OD values binned by week after PCR testing from 244 samples from COVID-19 patients requiring intubation and 109 samples from patients who did not. To avoid sampling bias due to patients with more severe disease having longer hospital stays, only samples from within the first 2 weeks after PCR testing were included in this analysis. P values with correction for multiple comparisons from one-way analysis of variance (ANOVA) are displayed. (D to F) ROC analysis in the above-described samples binned by intubation status. (G) Statistical comparison of ROC areas under the curve (AUCs) by Student’s t test using Z-scores derived from AUC values and standard errors (SE).

