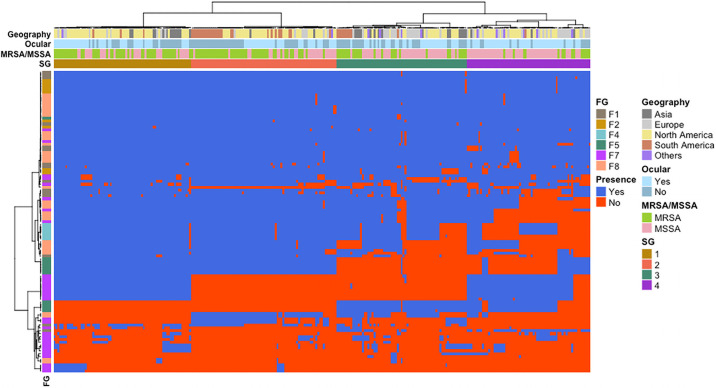
Fig 4. Heatmap plot demonstrating the pattern of virulence factor distribution across both ocular and non-ocular isolates.
Using a Ward’s minimum variance method, the phylogenetic tree across the top was created based on the presence/absence of 235 known S. aureus virulence factors, while the tree on the left-hand side is a representation of virulence factor similarity. The geographical origin of the isolates, MRSA/MSSA status as well as ocular vs non-ocular designation is represented in rows. Conversely, columns represent individual virulence factors with functional groups (FG): F1—Adherence; F2—Cytotoxin/hemolysin; F4—Protease inhibitor; F5—Capsular polysaccharide; F7—Immune modulator; F8—Toxin.

