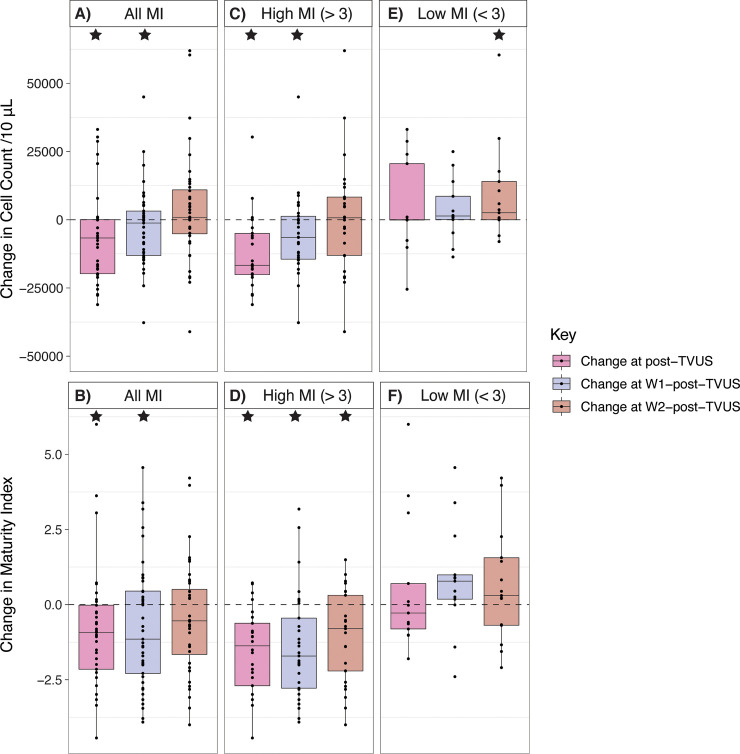
Fig 2. Dashed lines represent change = 0.
Stars represent significant pairwise differences from pre-TVUS samples. A. For all participants, the change in VE cell count per 10 μL CVF in samples taken approximately 12 hours later (post-TVUS), within one week (W1-post-TVUS), and within two weeks (W2-post-TVUS), compared to immediately before TVUS. B. For all participants, the change in maturity index (MI) of samples taken approximately 12 hours later (post-TVUS), within one week (W1-post-TVUS), and within two weeks (W2-post-TVUS), compared to immediately before TVUS. C. For only participants with a pre-TVUS MI > 3, the change in VE cell count per 10 μL CVF in samples approximately 12 hours later (post-TVUS), within one week (W1-post-TVUS), and within two weeks (W2-post-TVUS), compared to immediately before TVUS. D. For only participants with a pre-TVUS MI > 3, the change in maturity index (MI) of samples taken approximately 12 hours later (post-TVUS), within one week (W1-post-TVUS), and within two weeks (W2-post-TVUS), compared to immediately before TVUS. E. For only participants with a pre-TVUS MI < 3, the change in VE cell count per 10 μL CVF in samples taken approximately 12 hours later (post-TVUS), within one week (W1-post-TVUS), and within two weeks (W2-post-TVUS), compared to immediately before TVUS. F. For only participants with a pre-TVUS MI < 3, the change in maturity index (MI) of samples taken approximately 12 hours later (post-TVUS), within one week (W1-post-TVUS), and within two weeks (W2-post-TVUS), compared to immediately before TVUS.

