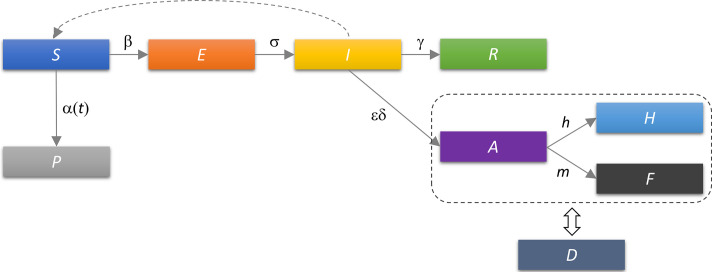
Fig. 3.
Schematic representation of the SPEIRD model. Compartments and the transition rates are as indicated in the text, where transitions between different compartments are marked by arrows. The time-dependent transition rate from susceptible to protected category α(t) is indicated by the solid arrow. The infected can transition to the recovered category either without being diagnosed (transition to R), or being diagnosed and then transitioning to confirmed healed or fatality cases. The dashed rectangle indicates that A, H, and F categories in the starting model are substituted for the cumulative case counts (D), which removes h and m from the analysis, where D is fitted to the observed data.

