FIG 5.
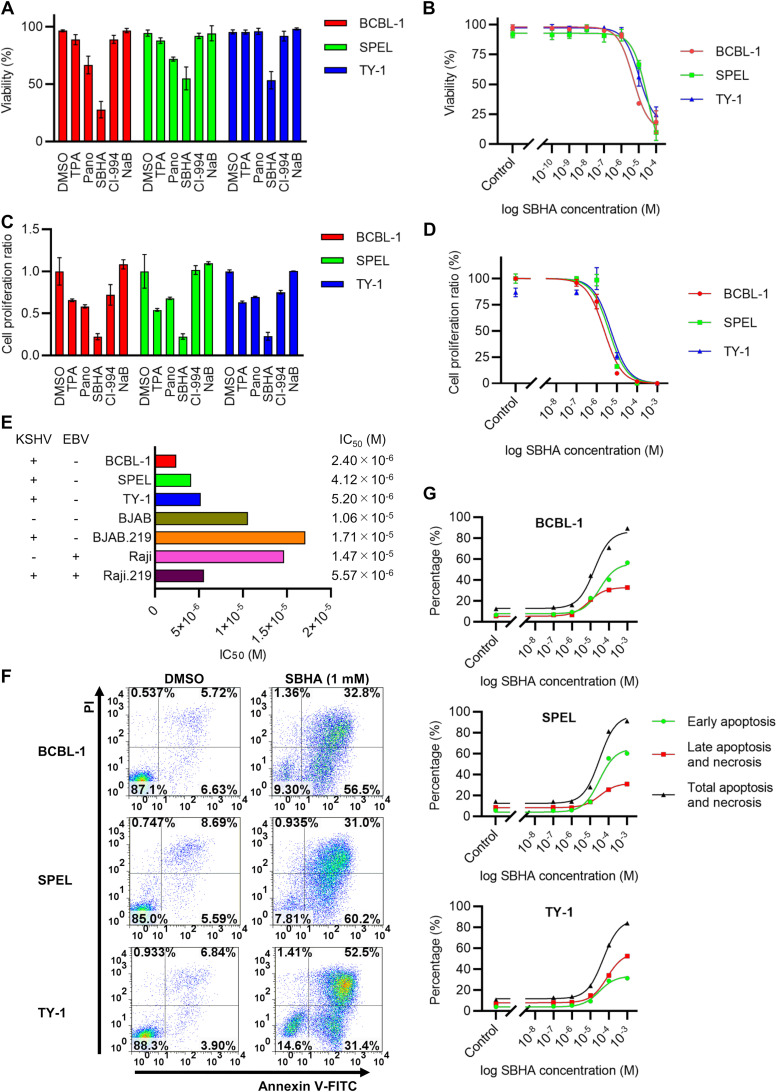
SBHA induces apoptosis in PEL cells. (A) Cell viability after drug treatment for 48 h determined by trypan blue stain. (B) Dose-response relationship between the SBHA concentration and cell viability. (C and D) XTT assay after drug treatment for 48 h. Cell proliferation ratios were compared among TPA and several HDAC inhibitors (C), and the dose-response relationship between the SBHA concentration and cell growth was determined (D). The averages from three independent experiments are shown, and error bars indicate the standard deviations. (E) IC50s of each drug against various cell lines. KSHV and EBV statuses are shown to the left. (F) Flow cytometry of annexin V. The fluorescence of FITC-labeled annexin V and PI was measured following 24 h of exposure to various concentrations of SBHA. The data from control (DMSO-treated) cells and SBHA-treated (1 mM) cells are shown. (G) Dose-response relationship between the SBHA concentration and apoptosis of PEL cells determined by an annexin V assay.

