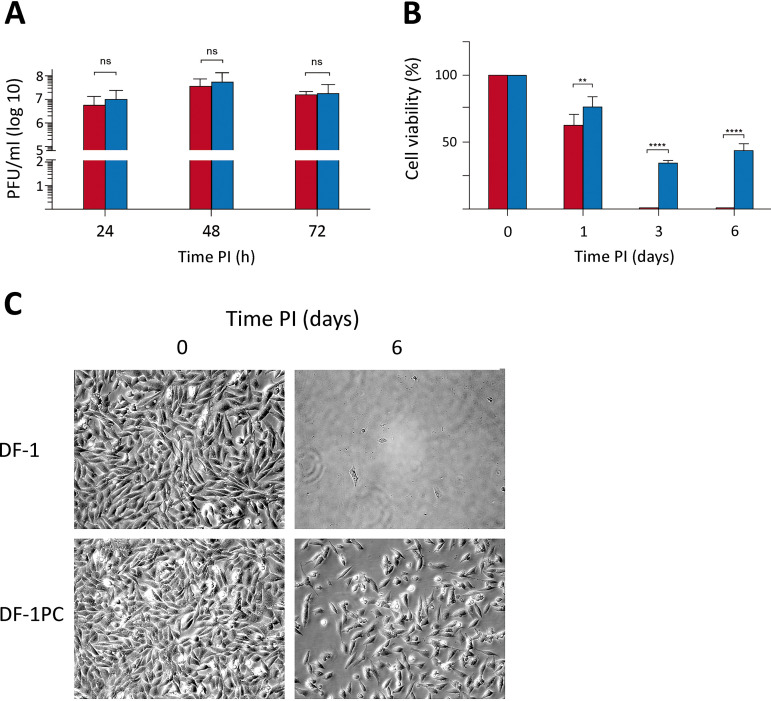
FIG 5.
Comparative analysis of naive DF-1 and DF-1PC regarding their susceptibility to IBDV infection and the capacity to survive the acute infection phase. DF-1 (red) and DF-1PC (blue) cell cultures were infected with WT IBDV (3 PFU/cell). (A) Cell supernatants were harvested at the indicated times p.i. and used for virus titration. Presented data correspond to the means ± standard deviations from three independent experiments. Brackets indicate pairwise data comparisons. ns, not significant as determined by two-way ANOVA. (B) Cell viability was determined at the indicated times p.i. using the MTT assay. Presented data correspond to the means ± standard deviations from three independent experiments. Brackets indicate pairwise data comparisons. **, P < 0.001; ****, P < 0.00001; determined by two-way ANOVA. (C) Phase-contrast microscopy images of infected DF-1 and DF-1PC cell cultures captured at the indicated times postinfection.

