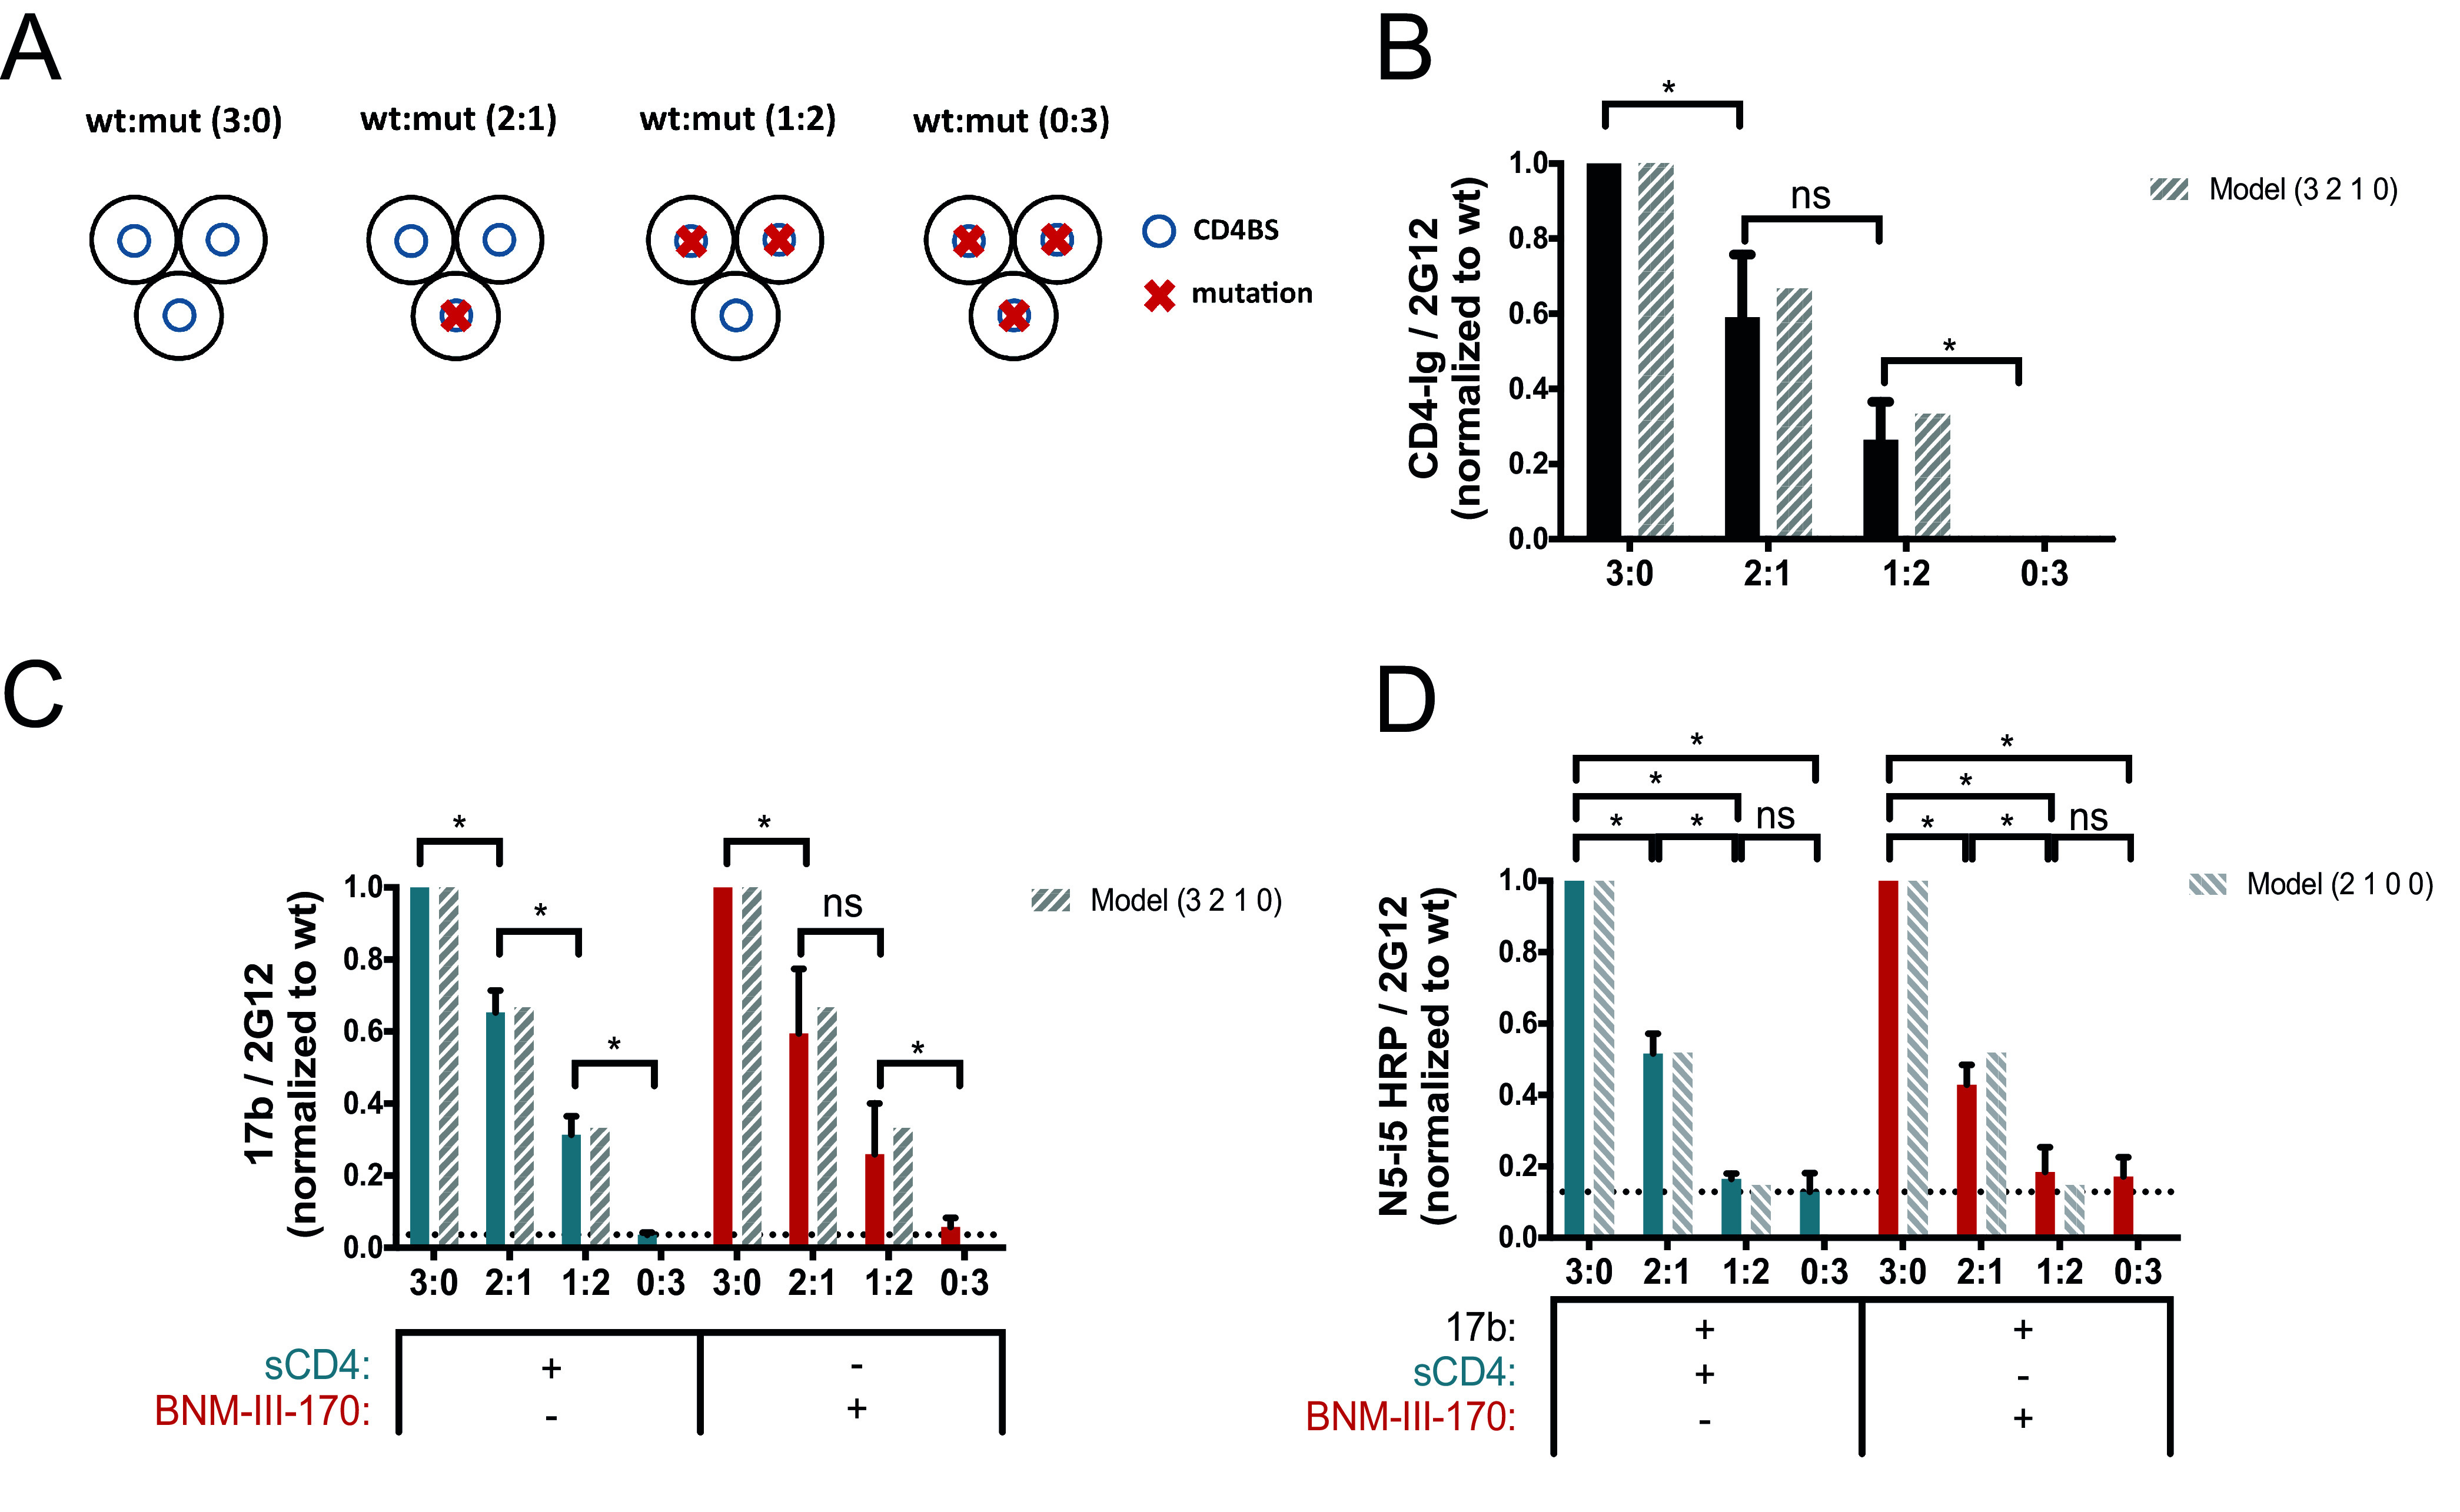
FIG 2.

Impact of CD4 binding on anti-cluster A epitope exposure. (A) Exposure of the gp120 cluster A region was evaluated with a cell-based ELISA by varying the concentrations of the wild type (wt) and the E370R CD4 binding site (CD4BS) variant (mut) (wt/E370R ratios of 3:0, 2:1, 1:2, and 0:3), as described in Materials and Methods. The ratios correspond to the ratio of the Env subunit transfected into the cells and represent the composition of the predominant trimer expressed at the cell surface as shown on the scheme. Env trimers are shown as three black circles representing the gp120 subunits, blue circles represent the CD4BS, and red crosses indicate the presence of the E370R mutation impairing CD4 interaction. (B to D) Recognition of cell-expressed trimeric Env by CD4-Ig (B), anti-CoRBS Ab 17b (C), or the HRP-conjugated anti-cluster A antibody N5-i5 (N5-i5-HRP) (D) was evaluated in the presence of sCD4 (3 μg/ml) or the CD4mc BNM-III-170 (5 μM), alone or in combination with 17b (1 μg/ml). N5-i5-HRP was used to avoid codetection of 17b and N5-i5 by a secondary antibody. The dashed bars show the predicted values calculated from the theoretical composition of trimers following a model that represents the predicted proportional binding values of each trimer. Data shown represent mean RLU values ± SEM from at least three independent experiments performed in quadruplicate, with the signal obtained from cells transfected with an empty pcDNA3.1 plasmid (no Env) subtracted, normalized to Env levels as determined by bNAb 2G12, relative to the wt. The dotted line is the threshold representing the background signal level. It is defined by the signal obtained with the 0:3 ratio (wt/mutant) in the presence of sCD4. Statistical significance was tested using an unpaired t test or a Mann-Whitney U test based on statistical normality (*, P < 0.05; ns, not significant).
