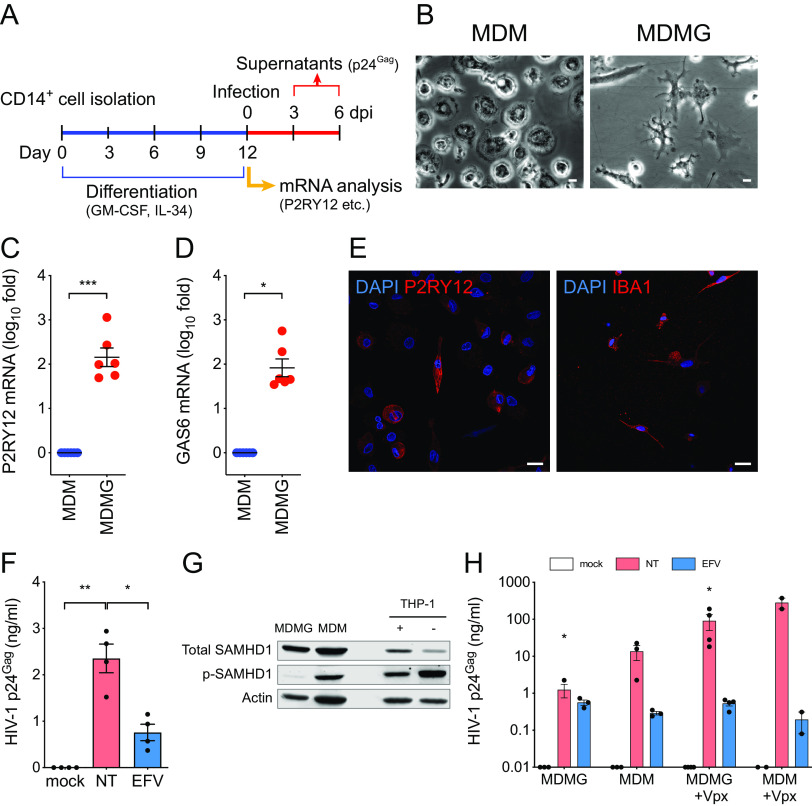
FIG 1.
Monocyte-derived microglia (MDMG) are susceptible to HIV-1 infection. (A) Schematic of MDMG differentiation protocol. (B) Representative image of MDMs or MDMGs differentiated from the same donor. Bars = 20 µm. (C and D) Expression of (C) P2RY12 and (D) GAS6 mRNA in MDMGs was quantified by reverse transcription-quantitative PCR (qRT-PCR) and normalized to that of MDM generated from the same donor. (E) Representative immunofluorescence images of MDMGs stained for nucleus (DAPI, blue) and P2RY12 or IBA-1 (red). Bar = 20 µm. (F) MDMGs were infected with Lai/YU-2env (replication-competent CCR5-tropic HIV-1, MOI = 1), and production of p24Gag in the culture supernatant was quantified by ELISA (3 days postinfection [dpi]). (G) Western blot analysis for total SAMHD1, phosphorylated SAMHD1 expression in MDMGs, MDMs and THP-1 cells. Actin was probed as a loading control. +, PMA-treated THP-1; –, unstimulated THP-1. (H) MDMGs and MDMs were infected with HIV-1 (LaiΔenvGFP/VSV-G, MOI = 2, in the absence or presence of SIVmac239 Vpx VLPs), and production of p24Gag in the culture supernatant was quantified by ELISA (3 dpi). NT, no treatment (DMSO); EFV, efavirenz (1 µM); Ral, raltegravir (30 µM). The means ± standard error of the mean (SEM) are shown, and each symbol represents an independent experiment. P values: one-sample t test (panel C, two-tailed), the Wilcoxon matched-pairs signed rank test (panel D, two-tailed), or one-way ANOVA followed by the Tukey-Kramer posttest (panel F) or Dunnett’s posttest comparing to mock (panel H). *, P < 0.05; **, P < 0.01; ***, P < 0.001.

