
FIG 1.
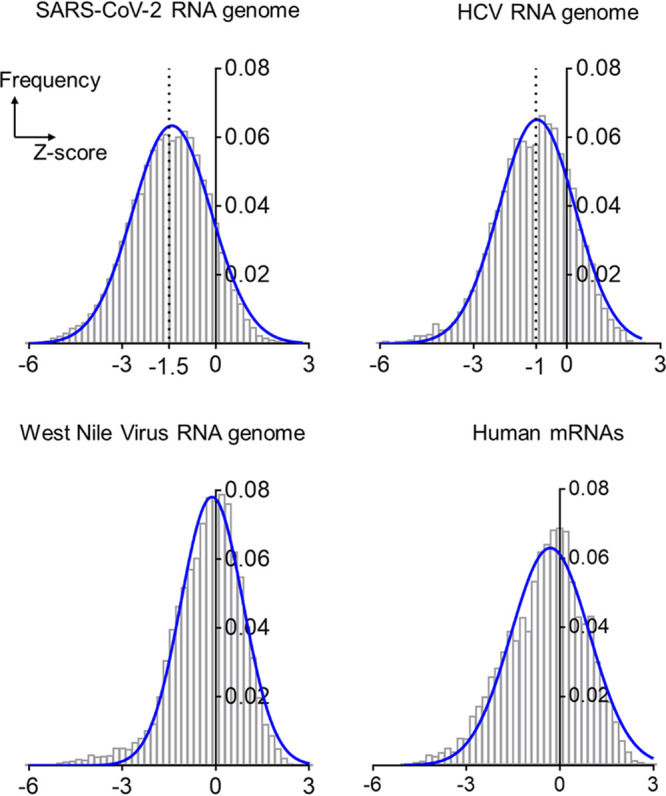
Distributions of Z-scores for the RNA genomes of SARS-CoV-2, HCV, and West Nile viruses and a composite of human mRNAs. The bar plots are frequency distributions (y axis) of free-energy Z-scores (x axis) calculated in sliding windows tiling each RNA. Each histogram is overlaid with a Gaussian (normal distribution) fit represented by a solid blue curve.