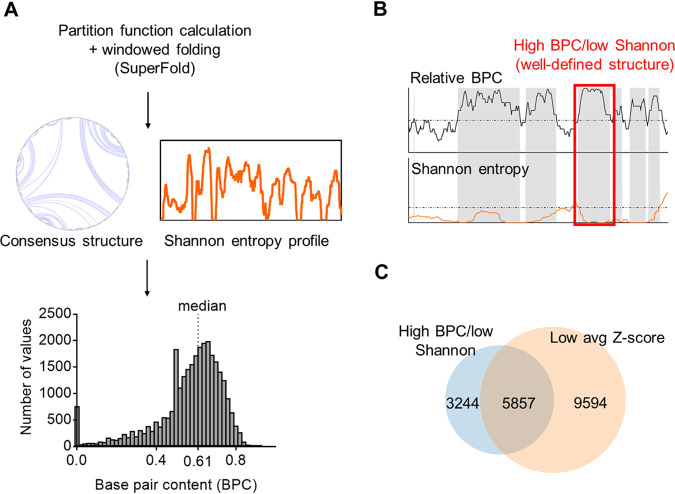
FIG 2.
A pipeline to predict and quantify the base pair content across SARS-CoV-2 genome and identify well-defined structured regions. (A) A scheme depicting the steps to predict the secondary structure of SARS-CoV-2 genome in windows using SuperFold. A histogram of base pair content (BPC) values calculated from the predicted secondary structure (gray bar plot) is shown, and the median BPC is indicated (0.61). (B) A strategy to identify well-defined structures. The scheme shows shaded regions containing nucleotides that pass two criteria: high relative BPC (upper graph, dashed line indicating the median value of 0.5) and low Shannon entropy (lower graph, dashed line indicating the global Shannon median). The red square highlights one of the regions flagged as forming a well-defined structure. (C) A Venn diagram showing the overlap between the total number of nucleotides identified as having well-defined structure using the procedure for panel B and those nucleotides with low average Z-scores (below the global median) as reported by Andrews et al. (13).

