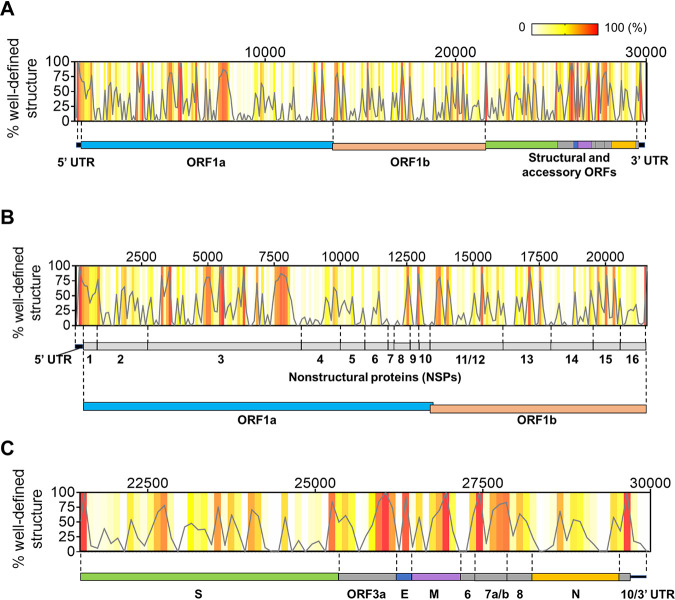
FIG 4.
Distribution of well-defined RNA structures across the SARS-CoV-2 genome. (A) The percentage of nucleotides in well-defined structured regions (high BPC/low Shannon) was calculated in 100-nt bins tiling the genome and is plotted as a function of the genomic coordinate (gray curve). Individual percentages of each genomic bin are also represented as a heat map in the same graph (color key on the top right-hand corner). A scheme representing the genomic divisions of SARS-CoV-2 is shown next to the plot to guide location of structured regions. (B) An expanded view of the initial two-thirds of the genome from the graph in panel A is shown along with the genomic divisions of this region (UTR plus ORF1ab and corresponding NSP divisions). (C) The downstream third of the genome is expanded from the graph in panel A to zoom in on individual structural and accessory ORFs in this region.

