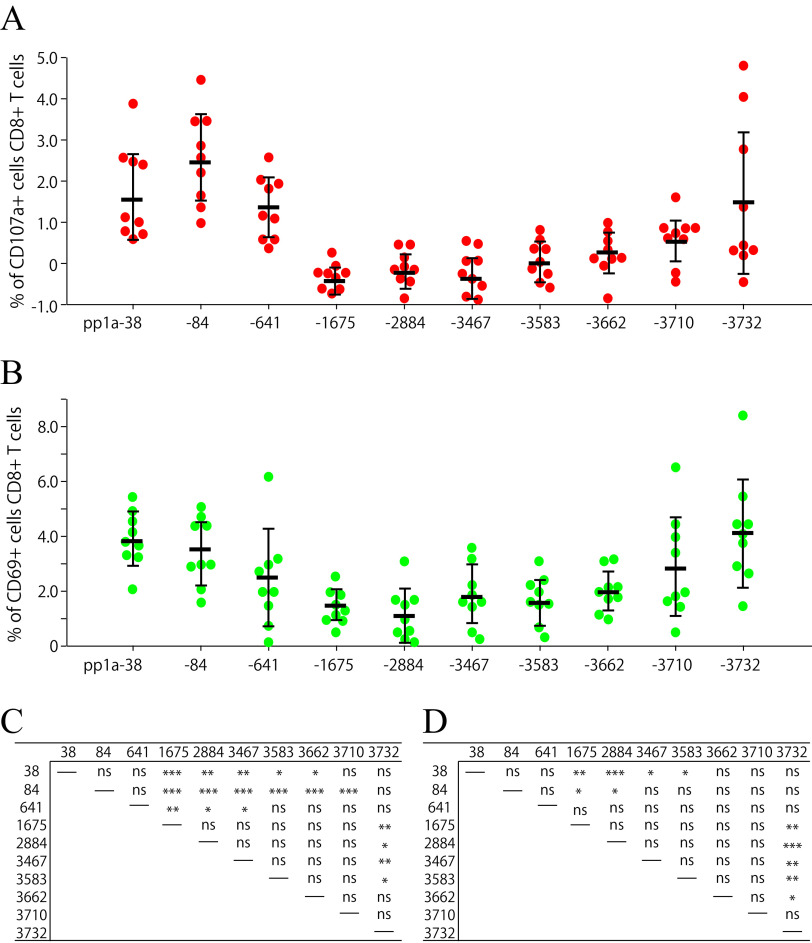
FIG 4.
Comparison of the 10 peptides in the induction of CD107a+ CD8+ T cells (A) and CD69+ CD8+ T cells (B). Nine HHD mice were immunized once with the mixture of 10 peptides (pp1a-38, -84, -641, -1675, -2884, -3467, -3583, -3662, -3710, and -3732) in liposomes with CpG. After 1 week, spleen cells were stimulated with or without each of the 10 peptides, and the expression of CD107a (A) or CD69 (B) on CD8+ T cells was analyzed. Data indicate the relative percentages of CD107a+ (A) and CD69+ (B) cells in CD8+ T cells, which were obtained by subtracting the % of CD107a+ and CD69+ cells in CD8+ T cells without a peptide from the % of CD107a+ and CD69+ cells in CD8+ T cells with a peptide, respectively. Each red (A) or green (B) circle represents an individual mouse. Data are shown as the mean (horizontal bars) ± SD. (C and D) Statistical analyses of the data among the 10 peptides in A and B were performed by one-way ANOVA followed by post hoc tests for CD107a (C) and CD69 (D) data: *, P < 0.05; **, P < 0.01; ***, P < 0.001; ns, not significant.

