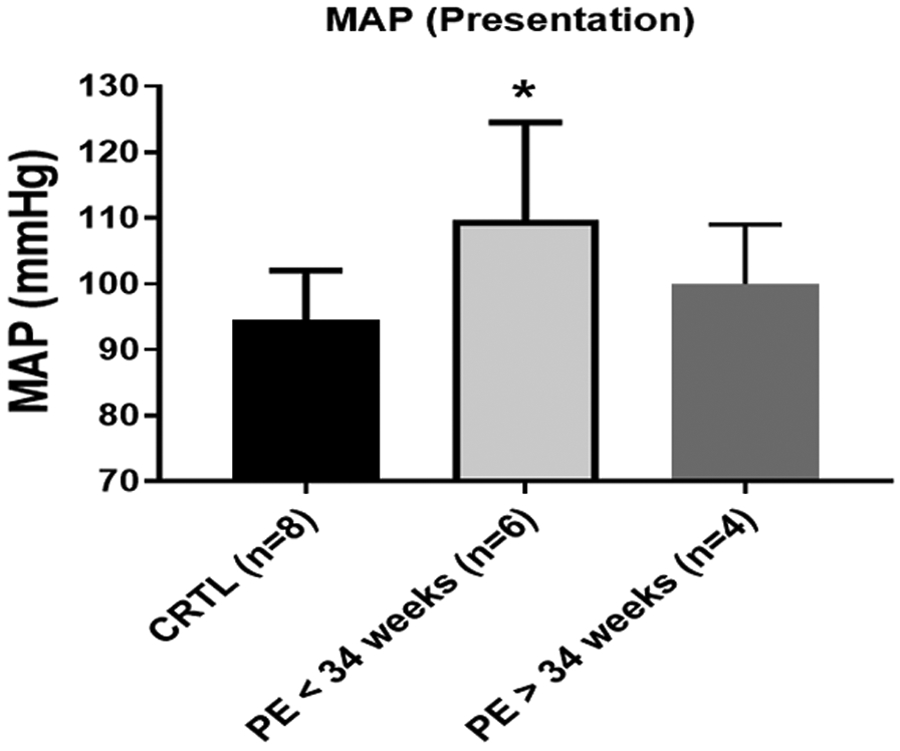
FIGURE 1. Differences in the MAP at presentation.

The control patients (n=8) and PE patients (n=10) (PE patients at <34 weeks [n=6] and PE patients at >34 weeks [n=4]), as separated by the serum samples used for the cell studies, displayed significant differences in the mean arterial blood pressure at presentation. The data are presented as mean ± standard deviation. The asterisk indicates a significant (P<.05) difference from the control group.
CRTL, control; MAP, mean arterial blood pressure; PE, preeclampsia.
