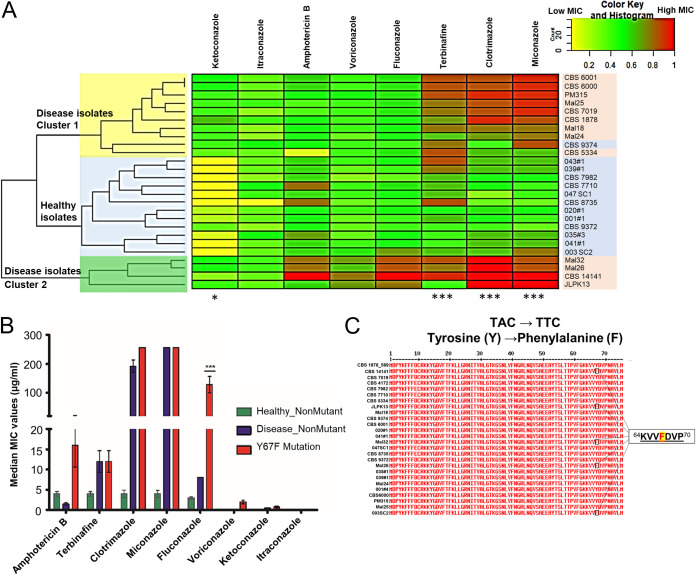
FIG 1.
The 26 strains of M. furfur used, including 13 healthy and 13 disease isolates. (A) Heat map of the MICs of 8 antifungals. MICs were normalized from 0 to 1, with 1 being the highest MIC (red) for each individual compound. Strains isolated from healthy individuals are highlighted in blue, and strains from individuals with disease are highlighted in red. A paired two-tailed t test (*, P < 0.05; ***, P < 0.005) was performed for median MICs between healthy and disease isolates. (B) Median MICs and standard deviations (SD) for healthy and disease wild-type and Y67F mutant strains. A one-way ANOVA was used with Dunnett’s test (***, P < 0.005). (C) CYP51 amino acid sequence showing the Y67F mutation in 5 isolates.

