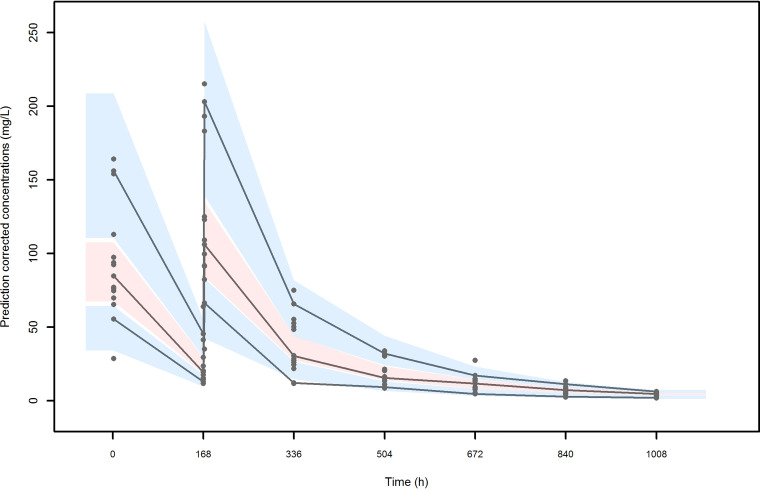
FIG 2.
Visual predictive check (VPC) of dalbavancin plasma concentration versus time for the final model. The continuous lines indicate the 10th, 50th, and 90th percentiles for observed data, while the shaded gray areas represent 90% prediction intervals from the corresponding percentiles calculated from simulated data.

