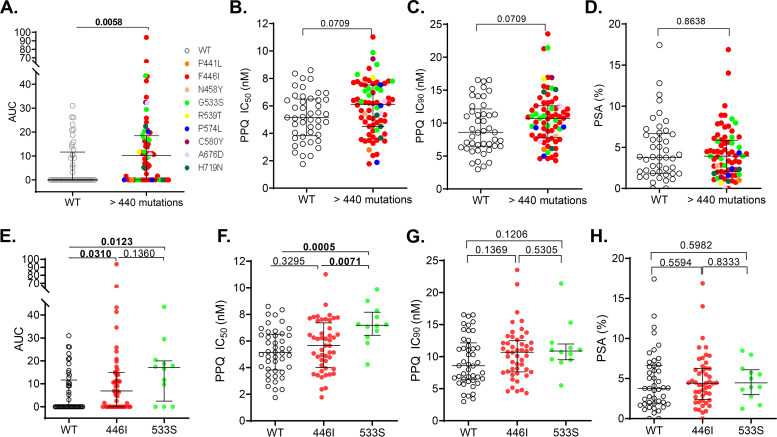
FIG 4.
Comparisons of in vitro piperaquine susceptibility (AUC [A and E], IC50 [B and F], IC90 [C and G], and PSA [D and H]) between parasites with PfK13 mutations (colored dots) and wild-type parasites (WT, open circles). PfK13 mutations were indicated by different colors. AUC, area under curve. Horizontal lines indicate medians ± IQRs. P values are indicated, and significance is highlighted in boldface (Mann-Whitney U test).

