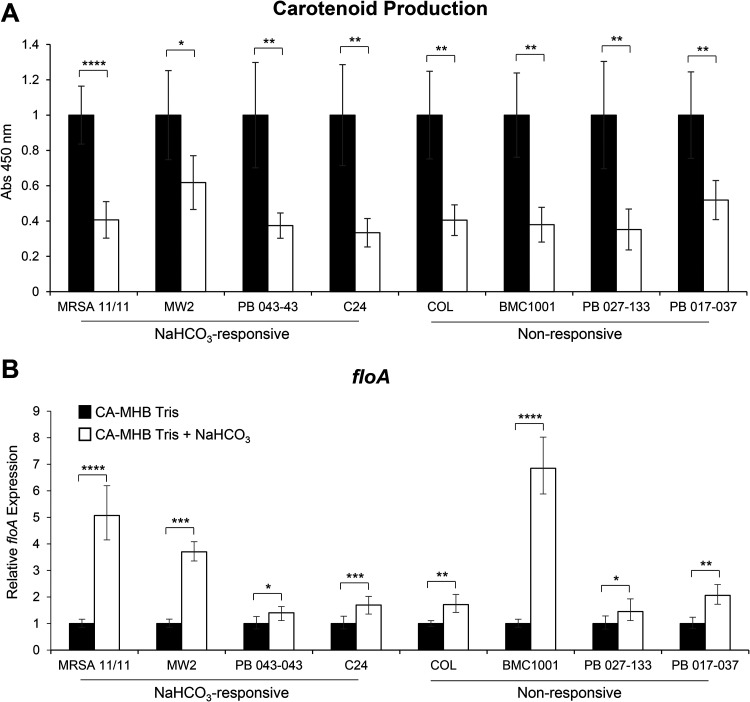
FIG 5.
Impact of NaHCO3 on FMM-associated factors. (A and B) Carotenoid production (A) and floA gene expression (B) in MRSA strains grown in the presence and absence of NaHCO3. floA gene expression was assessed by qRT-PCR using RNA extracted from log-phase cells (OD600, 0.4) in the presence of 0.5× MIC oxacillin. Black bars indicate growth in CA-MHB with 100 mM Tris, white bars indicate growth in CA-MHB with 100 mM Tris plus 44 mM NaHCO3 for all graphs, and error bars indicate the CT standard deviations. Student’s t test was used for statistical analyses. *, P < 0.05; **, P < 0.01; ***, P < 0.001; ****, P < 0.0001.

