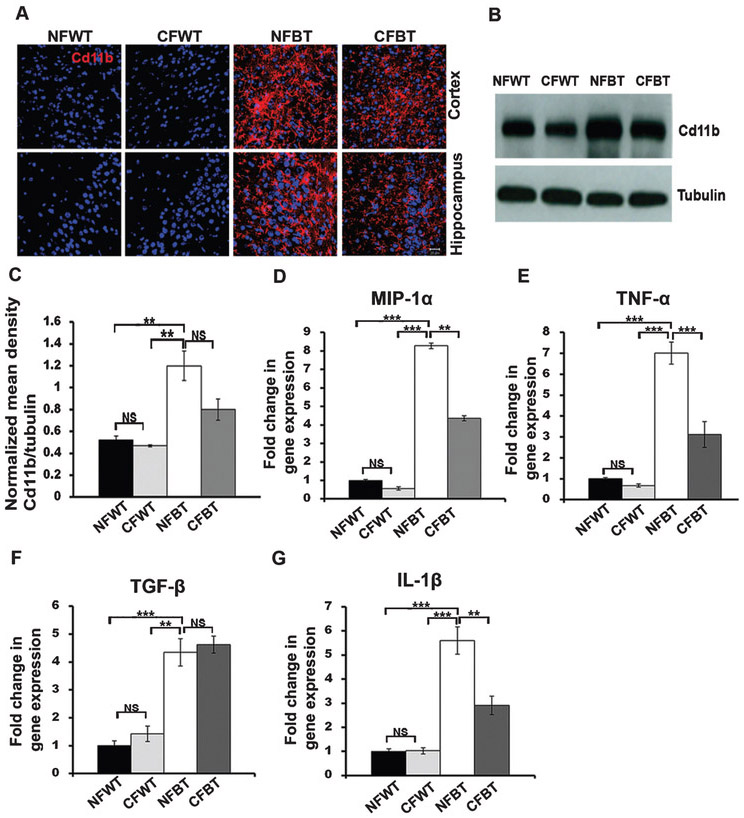
Fig. 3.
Reduced pro-inflammatory microglial activation and chemokine/cytokine expression levels in curcumin-treated p25Tg mice. A) Confocal images from the cortex and hippocampus of the brain sections from 18-week-old wild type mice with normal feed (NFWT), wild type mice with curcumin feed (CFWT), 12-week induced (18-week-old) p25Tg mice with normal feed (NFBT), and p25Tg mice with curcumin feed (CFBT) (n = 3) using anti-Cd11b antibody (red). Nuclei were stained with DAPI (blue). Scale bars represent 20 μm. B) Western blot analyses results of brain lysates from 12-week induced p25Tg/control mice with/without curcumin treatment using anti-Cd11b antibody (n = 3). C) Quantification of Cd11b immunoblots in (B) by densitometric scanning (**p < 0.01 and NS p > 0.05) (one-way ANOVA followed by post-hoc Tukey’s test). Real-Time PCR results for (D) MIP-1α, (E) TNF-α, (F) TGF-β, and (G) IL-β expression levels in 12-week induced p25Tg/control mice with/without curcumin treatment (n = 3) (***p < 0.001, **p < 0.01, and NS p > 0.05) (one-way ANOVA followed by post-hoc Tukey’s test). Error bars indicate ± s.e.m.

