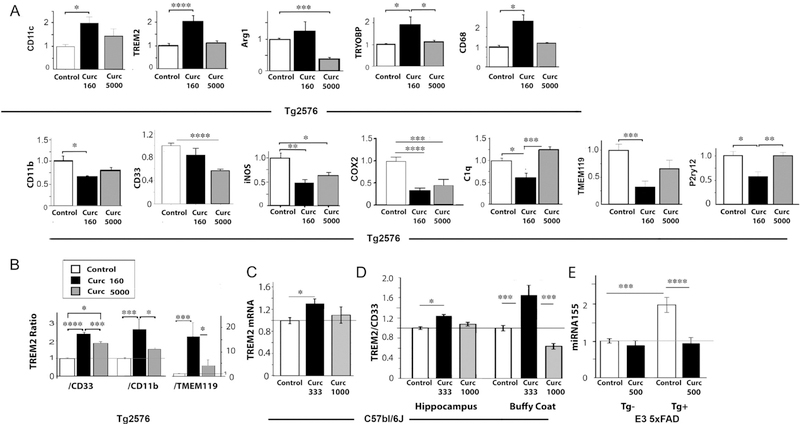
Fig. 2.
Gene mRNA levels differentially regulated and restored by low and/or high dose curcumin. (A) Gene expression mRNA levels were measured by quantitative RT-PCR (Taqman method), and levels were normalized to levels of GAPDH or HPRT in each sample. Each gene’s mRNA level was normalized to the average level in the Tg + Control diet animals, whose expression levels are therefore defined as 1.0 in the bar graph. (B) The ratio of mRNA levels for TREM2 and either CD33, CD11b, or TMEM119 were calculated. Curcumin increased the TREM2:CD33, TREM2:CD11b, and TREM2:TMEM119 gene expression ratios, more so with low dose curcumin than high dose curcumin. (C) TREM2 mRNA levels in hippocampus of C57Bl/6J mice at 19 months treated with curcumin in diet at doses of 333 ppm and 1000 ppm for 7 days. TREM2 levels were normalized to GAPDH mRNA in the same samples. (D) The ratio of mRNA levels of TREM2 to CD33 (normalized to GAPDH) in hippocampus and blood buffy coat of C57Bl/6J mice at 19 months treated with curcumin in diet at doses of 333 ppm and 1000 ppm for 7 days. (E) ApoE3–5XFAD mice (Tg+) with targeted hu ApoE3 and littermate 5xFAD transgene negative (Tg-) (n = 6–10/group) were treated with curcumin at 500 PPM for 2 months starting at 13 months age. Brain cortex was used to measure microRNA155 (normalized to miR672). The FAD-dependent increase in miR155 was effectively reduced by curcumin to control levels. Error bars indicate the SEM; *p < .05; **p < .01; ***p < .005; ****p < .0001. Multivariate analysis was used and post hoc tests included Fisher’s LSD with homogeneity or Games Howell when variances were unequal (p < .05 Levene’s test, Table 1).

